

Kenya’s mobile, internet, search, device and ad spend figures from CA, KNBS, StatCounter and DataReportal, each with its period, source and unit.
The figures people quote about Kenya’s internet come from different sources that count different things: SIM cards, people, page views or estimates. This page keeps the latest figure from each source with its unit and period, so you can cite the right one.
Key findings
- 88.0 millionmobile SIM subscriptions in June 2026, 165 per 100 people. They count active SIM cards, not people (CA).
- 35.0%of Kenyans aged 3 and over used the internet in 2024: 56.6% in towns, 25.0% in rural areas (KNBS).
- 52.3 millionsmartphones on mobile networks in June 2026, up from 43.8 million a year earlier, against 27.4 million feature phones (CA).
- 97.2%of search engine referrals in October 2026 came from Google: 99.4% on mobile, 87.4% on desktop, where Bing had 11.1% (StatCounter).
What each source counts
| Source | Counts | Do not read it as | How often |
|---|---|---|---|
| Communications Authority of Kenya (CA) | Subscriptions, devices and traffic reported by operators. A subscription is a SIM or line used in the last three months. | Number of people. One person can hold several SIMs. | Quarterly |
| KNBS household survey | People aged 3 and over and households, from interviews, with county and group breakdowns. | This year’s figure: fieldwork was March–May 2024. | Occasional surveys |
| StatCounter | Page views on websites running its tracking code, and the search engines that referred them. | Searches made, keyword volume or device ownership. | Monthly |
| DataReportal | A yearly compilation of other sources (UN, GSMA Intelligence, ITU, ad platforms) plus its own estimates. | A primary source. Trace each figure to the source it names. | Yearly |
Mobile and internet connections
Operator figures for June 2026 against June 2025. They show how many SIMs, data plans and devices are active, not how many people are online.
Kenya statistics · connections
Kenya had 88.0 million active SIMs in June 2026, 165 for every 100 people


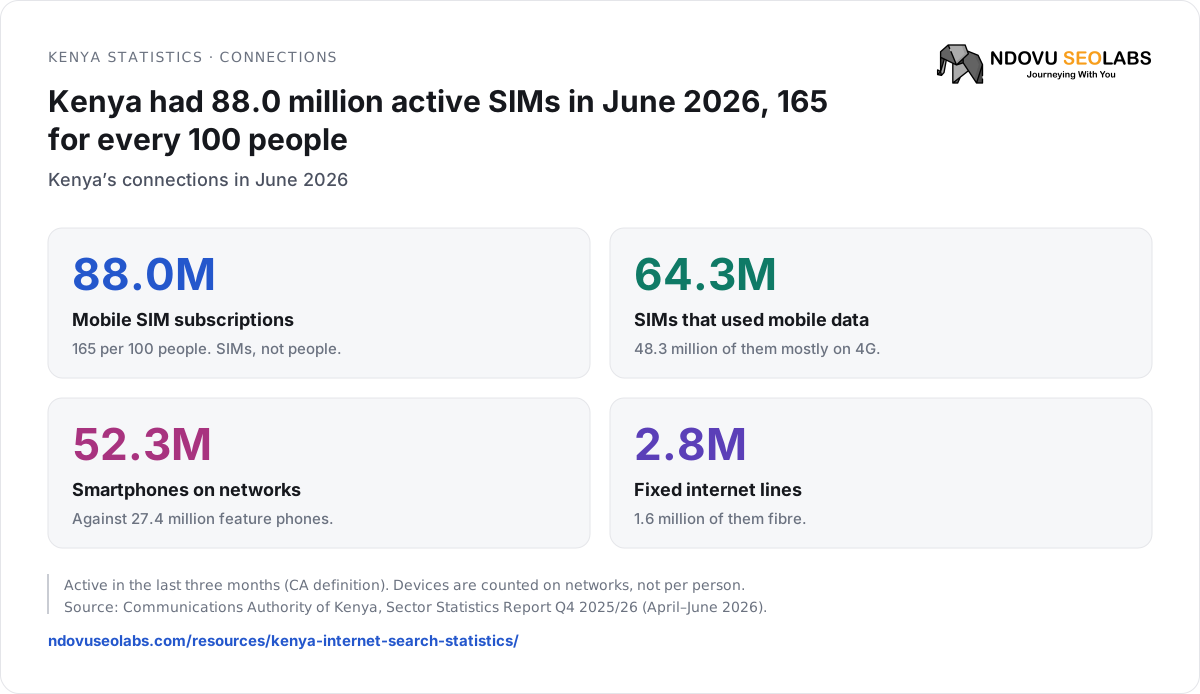
Active in the last three months (CA definition). Devices are counted on networks, not per person.
Source: Communications Authority of Kenya, Sector Statistics Report Q4 2025/26 (April–June 2026).
| Figure | June 2026 | June 2025 | Unit |
|---|---|---|---|
| Mobile SIM subscriptions | 87,999,998 | 76,690,718 | Active SIMs |
| Mobile penetration | 165.0 | 146.3 | SIMs per 100 people* |
| Mobile data subscriptions | 64,263,694 | 58,575,082 | SIMs that used data |
| … on 4G | 48,312,139 | 37,179,446 | SIMs |
| … on 5G | 2,103,217 | 1,247,713 | SIMs |
| … on 3G | 4,509,901 | 7,363,831 | SIMs |
| … on 2G | 9,338,437 | 12,784,092 | SIMs |
| Fixed data subscriptions | 2,838,656 | 2,144,713 | Lines |
| … fibre | 1,566,815 | 1,207,583 | Lines |
| … fixed wireless | 1,030,770 | 721,167 | Lines |
| … cable modem | 204,747 | 196,486 | Lines |
| … satellite | 27,695 | 17,939 | Lines |
| Smartphones on networks | 52,262,565 | 43,751,716 | Devices |
| Feature phones on networks | 27,420,856 | 29,478,816 | Devices |
| Mobile money subscriptions | 54,005,800 | 47,720,195 | Accounts used in 90 days |
| Mobile broadband traffic (3G, 4G, 5G) | 933,875,953 | 620,189,223 | GB in the quarter |
| International bandwidth used | 19,432.074 | – | Gbps, June 2026 |
* CA divides by the population in the KNBS Economic Survey: 53,330,978 for 2026 and 52,428,290 for 2025. Each SIM is counted under the network generation that carried most of its traffic (CA indicators manual). CA’s text gives SIM growth as 4.6% “from June 2025”; that is the change from March to June 2026. Year on year the count rose 14.7% (derived).
Measured: 1 April–30 June 2026 and 1 April–30 June 2025 · Published: September 2026 (the report prints no date) and September 2025 · Last checked: 19 November 2026 · Source: CA Sector Statistics Report Q4 2025/26 (SIMs p. vii; data Figure 4 p. 4; fixed Table 11 p. 15; devices p. 6; mobile money p. 3; traffic p. 4; bandwidth Table 15 p. 18) and Q4 2024/25
Kenya statistics · connections
4G now carries 48.3 million of Kenya’s 64.3 million mobile data SIMs
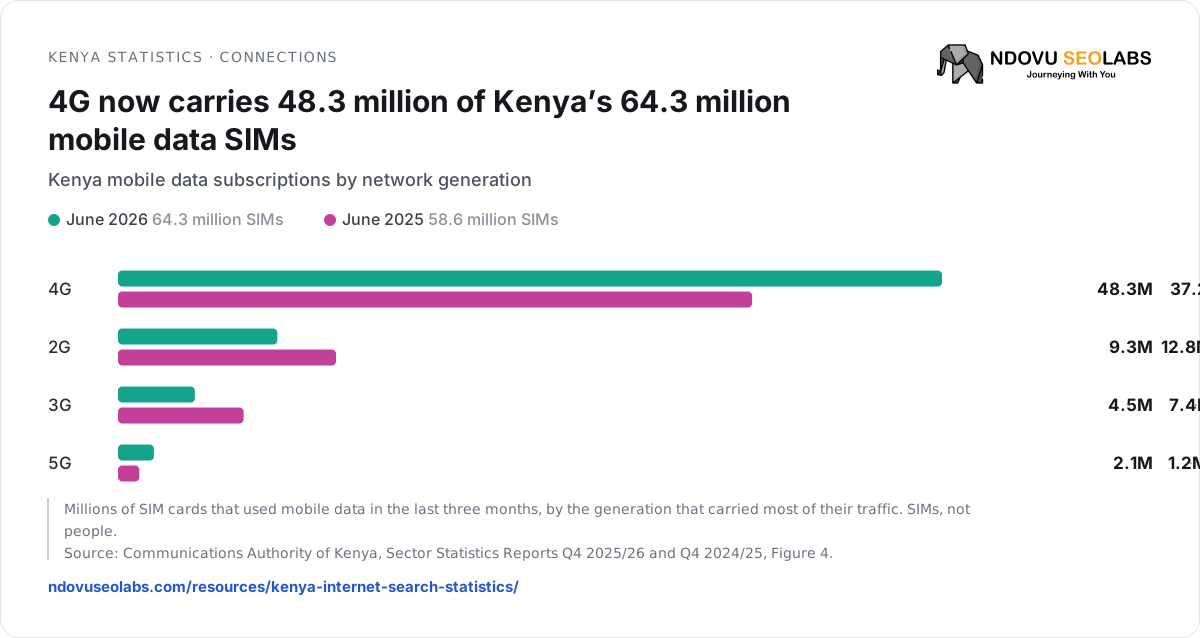
- June 2026 64.3 million SIMs
- June 2025 58.6 million SIMs
Millions of SIM cards that used mobile data in the last three months, by the generation that carried most of their traffic. SIMs, not people.
Source: Communications Authority of Kenya, Sector Statistics Reports Q4 2025/26 and Q4 2024/25, Figure 4.
Kenya statistics · connections
In a year, 4G data SIMs rose 29.9% and 2G fell 27.0%, while mobile broadband traffic grew 50.6%
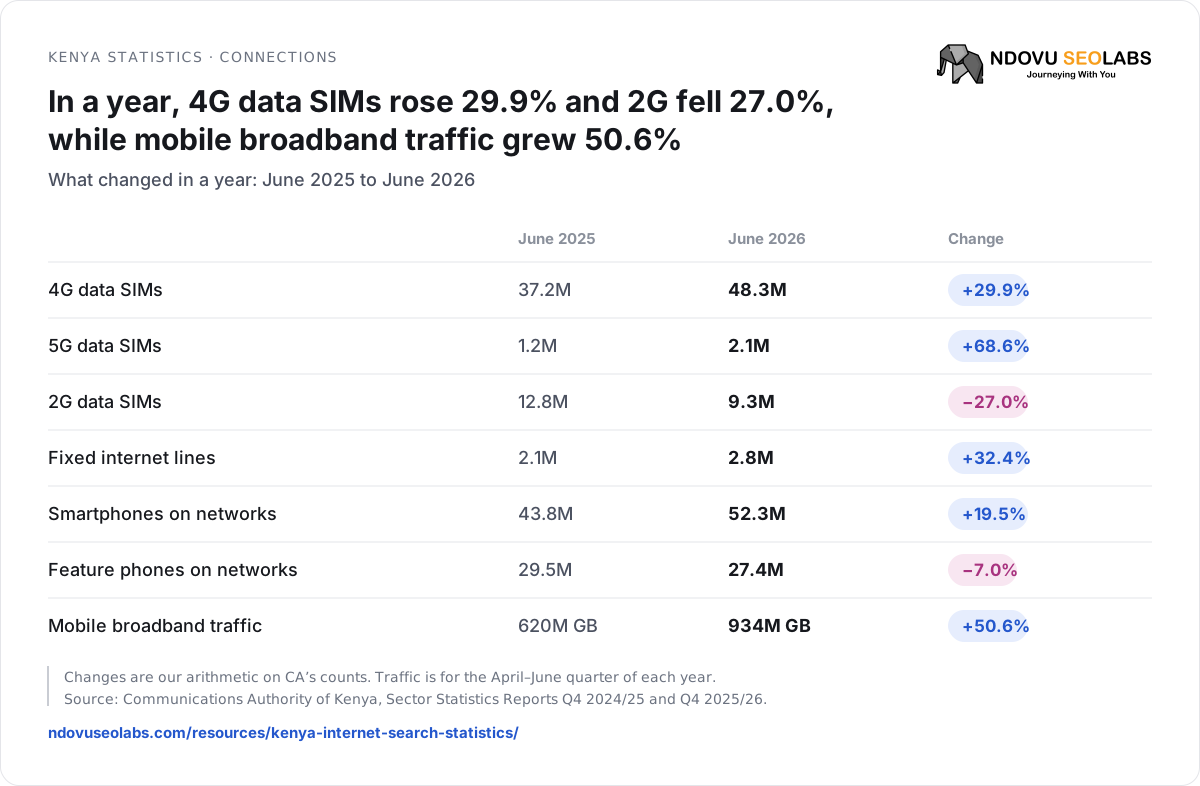
Changes are our arithmetic on CA’s counts. Traffic is for the April–June quarter of each year.
Source: Communications Authority of Kenya, Sector Statistics Reports Q4 2024/25 and Q4 2025/26.
| Network coverage, 2025 | Share of population | Unit |
|---|---|---|
| 4G mobile coverage | 98% | Population covered |
| 5G mobile coverage | 30% | Population covered |
Measured: 2025 (provisional) · Published: April 2026 · Last checked: 19 November 2026 · Source: KNBS Economic Survey 2026, Table 14.2, p. 324
| Internet speed (median) | Download | Upload | Latency | Global rank |
|---|---|---|---|---|
| Mobile | 43.07 Mbps | 9.58 Mbps | 29 ms | 86 |
| Fixed broadband | 25.58 Mbps | 23.78 Mbps | 10 ms | 137 |
Medians of Speedtest results. The page shows the mean first (mobile 114.18 Mbps), which is not the same figure. Each month covers a rolling three months.
Measured: Rolling quarter to September 2026 · Published: Updated mid-month · Last checked: 19 November 2026 · Source: Ookla Speedtest Global Index: Kenya
Who uses the internet
The household survey is the only source here that counts people. Covering everyone aged 3 and over, it shows the gaps that subscription counts hide.
| Indicator | Value | Population |
|---|---|---|
| Used the internet | 35.0% | People aged 3+ |
| … men / women | 37.8% / 32.2% | People aged 3+ |
| … urban / rural | 56.6% / 25.0% | People aged 3+ |
| … aged 18–34 | 58.6% | Young people |
| Owned a mobile phone | 53.7% | People aged 3+ |
| Used a mobile phone | 64.9% | People aged 3+ |
| Used a computer | 11.6% | People aged 3+ |
| Households with internet access | 36.3% | Households |
| … urban / rural | 54.1% / 25.1% | Households |
| … fixed internet | 7.0% | Households |
| Households with a computer | 8.8% | Households |
KNBS reports ages 3 and over; there is no figure for adults only. Media reports of “53.7% internet use” confuse it with phone ownership.
Measured: Fieldwork 7 March–17 May 2024 · Published: August 2025 · Last checked: 19 November 2026 · Source: KNBS and CA, Analytical Report on ICT, 2023/24 Kenya Housing Survey (Table 0A p. xv, Table 0B p. xviii, Figure 2.37 p. 54)
Kenya statistics · people
56.6% of Kenyans in towns used the internet, against 25.0% in rural areas
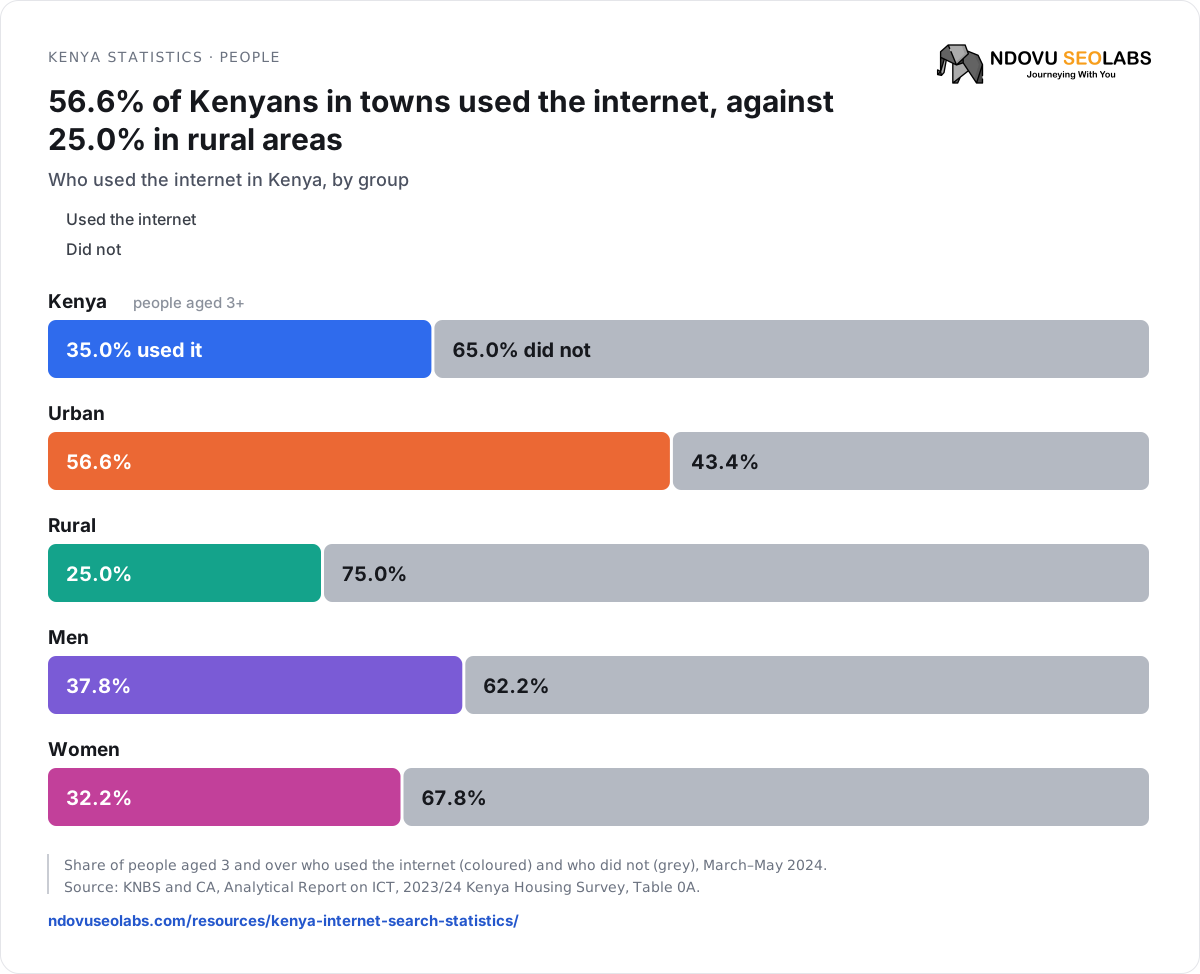
- Used the internet
- Did not
Kenyapeople aged 3+
Urban
Rural
Men
Women
Share of people aged 3 and over who used the internet (coloured) and who did not (grey), March–May 2024.
Source: KNBS and CA, Analytical Report on ICT, 2023/24 Kenya Housing Survey, Table 0A.
Kenya statistics · people
Internet use ranges from 64.7% in Nairobi City to 9.1% in West Pokot
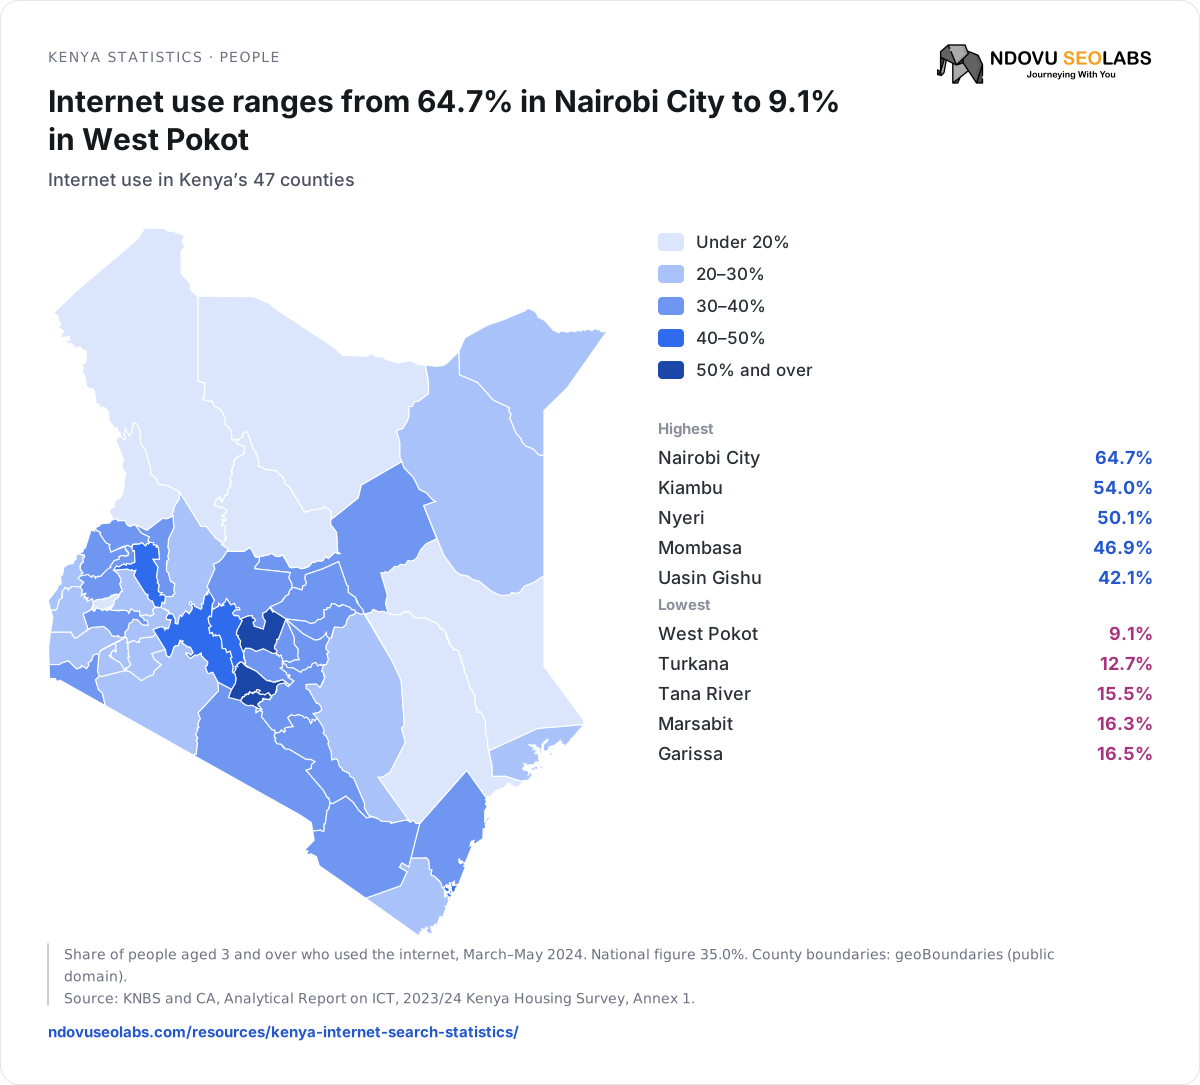
- Under 20%
- 20–30%
- 30–40%
- 40–50%
- 50% and over
Highest
- Nairobi City64.7%
- Kiambu54.0%
- Nyeri50.1%
- Mombasa46.9%
- Uasin Gishu42.1%
Lowest
- West Pokot9.1%
- Turkana12.7%
- Tana River15.5%
- Marsabit16.3%
- Garissa16.5%
Share of people aged 3 and over who used the internet, March–May 2024. National figure 35.0%. County boundaries: geoBoundaries (public domain).
Source: KNBS and CA, Analytical Report on ICT, 2023/24 Kenya Housing Survey, Annex 1.
All 47 counties
| County | Used the internet |
|---|---|
| Nairobi City | 64.7% |
| Kiambu | 54.0% |
| Nyeri | 50.1% |
| Mombasa | 46.9% |
| Uasin Gishu | 42.1% |
| Nyandarua | 41.6% |
| Nakuru | 40.1% |
| Laikipia | 38.0% |
| Taita-Taveta | 37.6% |
| Machakos | 37.3% |
| Kajiado | 37.0% |
| Embu | 36.8% |
| Kirinyaga | 36.6% |
| Murang'a | 35.8% |
| Kakamega | 35.0% |
| Bungoma | 34.9% |
| Tharaka-Nithi | 33.4% |
| Kisumu | 33.4% |
| Isiolo | 33.1% |
| Meru | 31.4% |
| Trans Nzoia | 30.6% |
| Kilifi | 30.5% |
| Migori | 30.4% |
| Makueni | 30.3% |
| Elgeyo-Marakwet | 30.3% |
| Busia | 29.7% |
| Lamu | 28.8% |
| Kisii | 28.1% |
| Homa Bay | 27.7% |
| Siaya | 27.4% |
| Kericho | 26.4% |
| Nyamira | 26.4% |
| Kitui | 26.2% |
| Kwale | 25.6% |
| Mandera | 24.9% |
| Nandi | 24.4% |
| Wajir | 24.2% |
| Baringo | 23.4% |
| Bomet | 20.6% |
| Narok | 20.5% |
| Samburu | 18.9% |
| Vihiga | 18.3% |
| Garissa | 16.5% |
| Marsabit | 16.3% |
| Tana River | 15.5% |
| Turkana | 12.7% |
| West Pokot | 9.1% |
Uasin Gishu is 42.1% in the report; the KNBS fact sheet prints 35.0%, the national figure. Annex 1 lists Nyamira and Nairobi City twice; the second rows repeat the same figures in a different column order.
Measured: Fieldwork 7 March–17 May 2024 · Published: August 2025 · Last checked: 19 November 2026 · Source: KNBS and CA, Analytical Report on ICT (Annex 1, pp. 77–78); boundaries from geoBoundaries (RCMRD, public domain)
Devices and social platforms people use
CA’s audience survey asks people how they go online and which platforms they use. It is a survey of people, unlike the operator counts above.
Kenya statistics · platforms
Facebook reaches 68.3% of people surveyed and WhatsApp 55.0%; TikTok and YouTube are near 30%
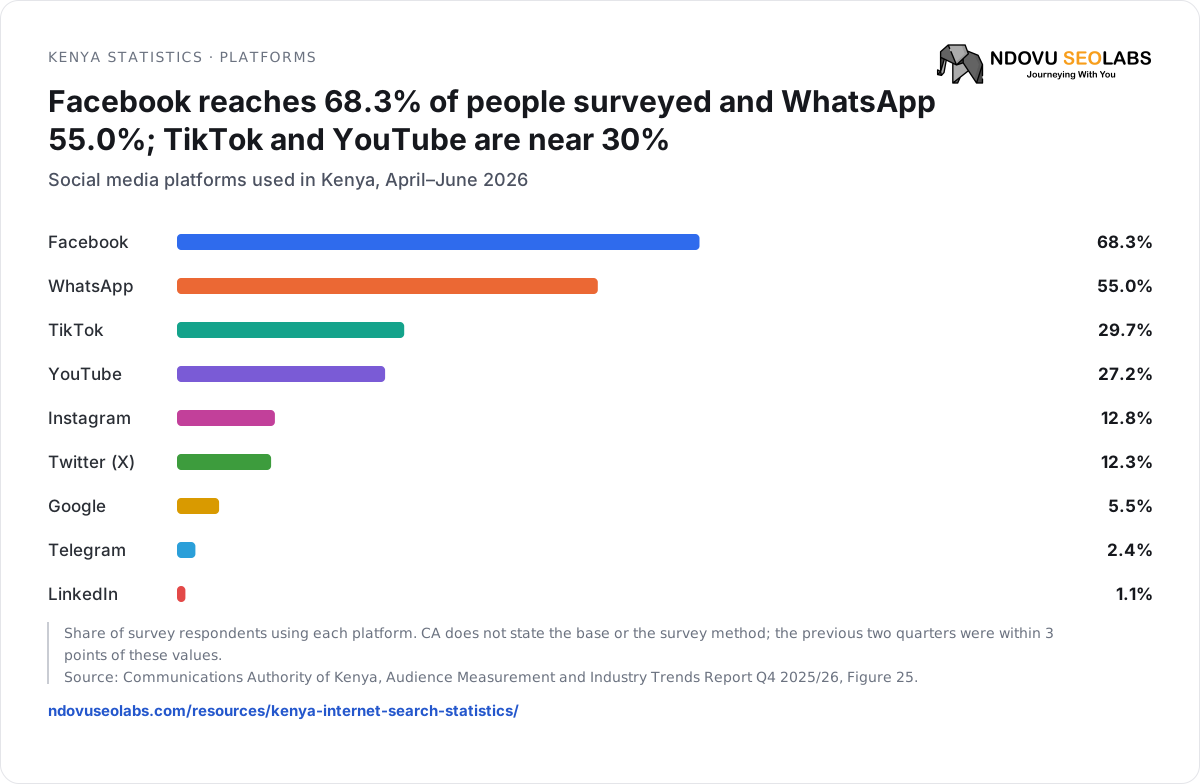
Share of survey respondents using each platform. CA does not state the base or the survey method; the previous two quarters were within 3 points of these values.
Source: Communications Authority of Kenya, Audience Measurement and Industry Trends Report Q4 2025/26, Figure 25.
| Device used to go online | Jul–Sep 2025 | Oct–Dec 2025 | Jan–Mar 2026 | Apr–Jun 2026 |
|---|---|---|---|---|
| Smartphone | 97.6% | 97.9% | 98.2% | 98.9% |
| Laptop | 5.1% | 6.0% | 5.8% | 5.8% |
| Smart TV | 1.9% | 1.4% | 1.2% | 1.5% |
| Tablet or iPad | 1.1% | 0.8% | 0.9% | 0.9% |
| Desktop | 0.9% | 0.5% | 0.6% | 0.6% |
People can name more than one device. Almost everyone surveyed goes online by phone, while StatCounter finds about half of page views on desktop: the survey counts people and StatCounter counts page views, so the two cannot be compared directly.
Measured: July 2025–June 2026, by quarter · Published: August 2026 · Last checked: 19 November 2026 · Source: CA Audience Measurement and Industry Trends Report Q4 2025/26 (Figures 23 and 25, pp. 26–27)
Search engines, devices and browsers
StatCounter measures what reaches websites: which search engine sent a visit and which device and browser loaded the page. Single months swing, so the last column gives the range over 12 months.
| Measure | Oct 2026 | Oct 2025 | 12-month range | Unit |
|---|---|---|---|---|
| Google, all devices | 97.20% | 96.36% | 95.77–97.20% | Search referrals |
| Bing, all devices | 2.27% | 2.86% | 2.27–3.43% | Search referrals |
| Google on mobile | 99.45% | 98.97% | 98.98–99.45% | Mobile search referrals |
| Google on desktop | 87.37% | 91.31% | 87.37–93.43% | Desktop search referrals |
| Bing on desktop | 11.13% | 7.71% | 5.57–11.13% | Desktop search referrals |
| Mobile | 52.56% | 57.73% | 29.47–53.93% | Page views |
| Desktop | 46.94% | 41.46% | 45.29–69.96% | Page views |
| Android | 94.93% | 94.44% | – | Mobile page views |
| iOS | 4.72% | 5.15% | 4.57–7.28% | Mobile page views |
| Chrome | 70.44% | 73.10% | – | Page views |
| Opera | 16.06% | 16.99% | – | Page views |
| Edge | 5.80% | 2.82% | – | Page views |
Referrals are clicks from a results page to a site using StatCounter, not searches made (StatCounter FAQ). Its last published Kenya sample was 10.6 million page views (July 2022). Desktop Bing doubled between August and September 2026 with no explanation from StatCounter. google.co.ke now redirects to google.com (checked 19 November 2026), part of a change Google announced in April 2025; Google says results stay local (Google).
Measured: October 2026 and October 2025; range November 2025–October 2026. October 2026 is provisional until StatCounter’s 45-day revision ends in mid-December 2026. · Published: Updated daily (monthly CSV export) · Last checked: 19 November 2026 · Source: StatCounter search engines, platforms, mobile OS, browsers
Kenya statistics · search
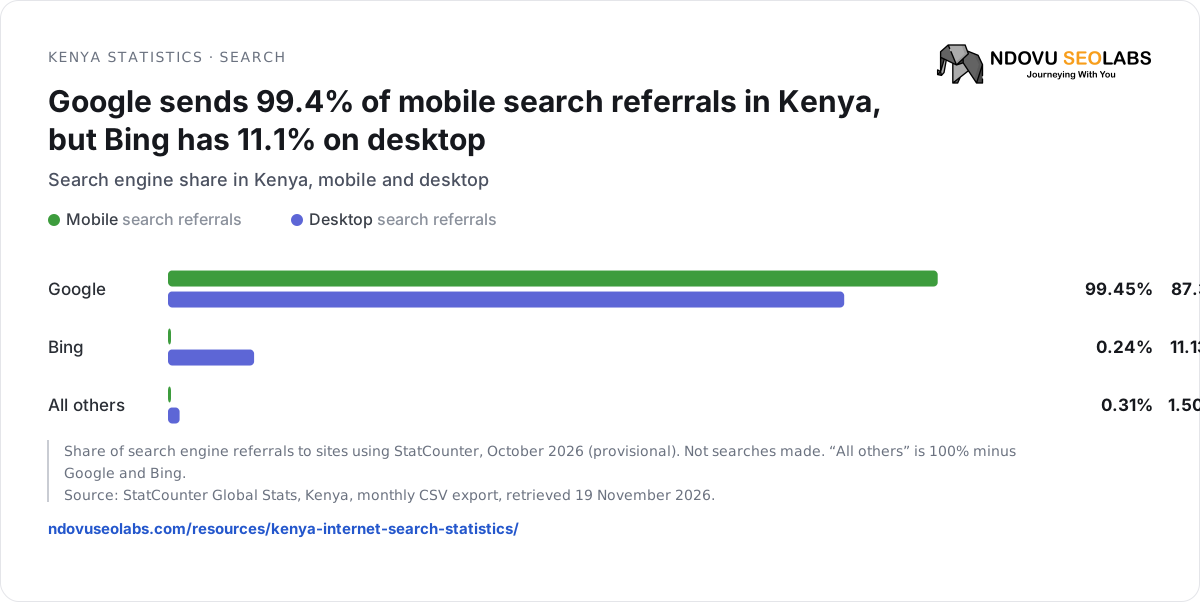
- Mobile search referrals
- Desktop search referrals
Share of search engine referrals to sites using StatCounter, October 2026 (provisional). Not searches made. “All others” is 100% minus Google and Bing.
Source: StatCounter Global Stats, Kenya, monthly CSV export, retrieved 19 November 2026.
Kenya statistics · devices
Mobile’s share of page views in Kenya swung between 29% and 54% in a single year
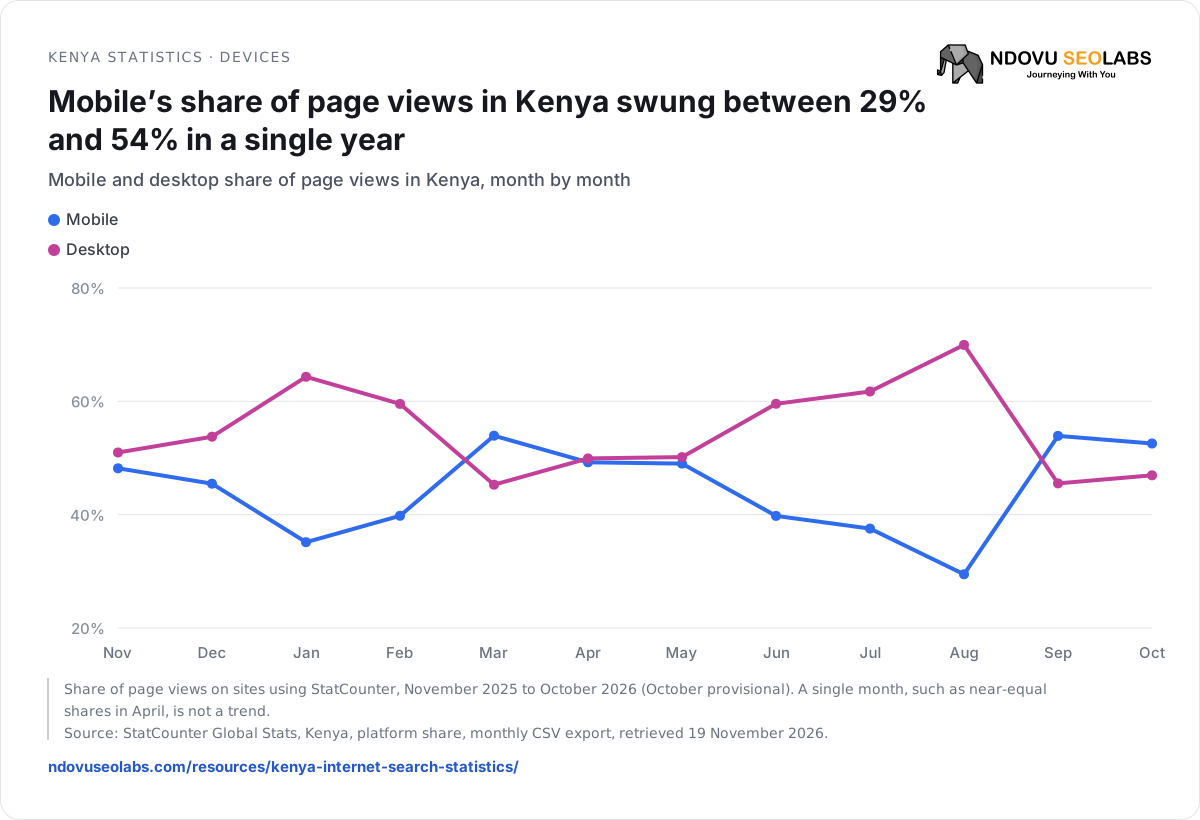
- Mobile
- Desktop
Share of page views
Share of page views on sites using StatCounter, November 2025 to October 2026 (October provisional). A single month, such as near-equal shares in April, is not a trend.
Source: StatCounter Global Stats, Kenya, platform share, monthly CSV export, retrieved 19 November 2026.
Kenya statistics · search
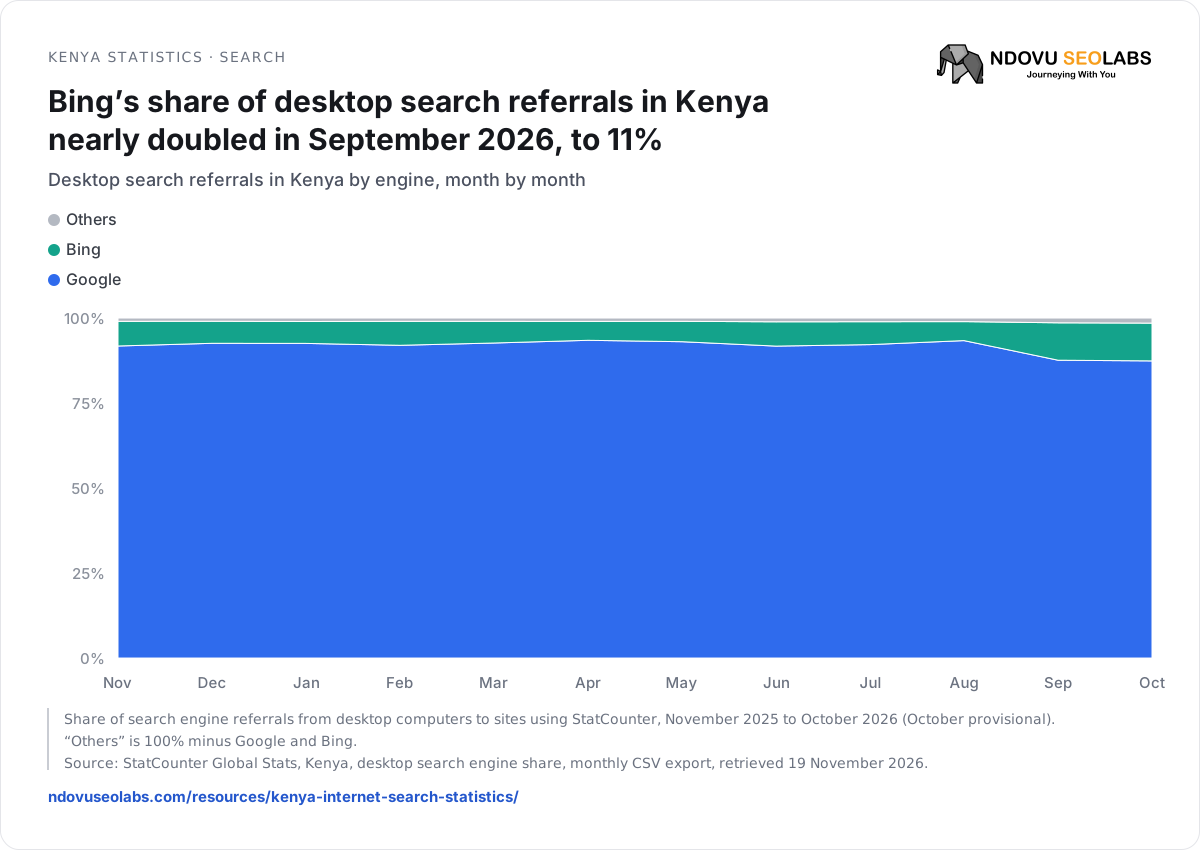
- Others
- Bing
Share of desktop search referrals
Share of search engine referrals from desktop computers to sites using StatCounter, November 2025 to October 2026 (October provisional). “Others” is 100% minus Google and Bing.
Source: StatCounter Global Stats, Kenya, desktop search engine share, monthly CSV export, retrieved 19 November 2026.
| Cloudflare Radar, Kenya | Share | Of |
|---|---|---|
| Mobile | 55.3% | Human HTTP requests |
| Desktop | 44.7% | Human HTTP requests |
| Bots | 48.2% | HTTP requests for HTML pages |
Measured: 24 October–17 November 2026 (last four weeks) · Published: Updated continuously · Last checked: 19 November 2026 · Source: Cloudflare Radar: Kenya traffic; read 19 November 2026
AI search in Kenya
| Feature | Available in Kenya | What Google says |
|---|---|---|
| AI Overviews | Yes | Kenya is on Google’s country list (Search Help). Its October 2024 expansion to over 100 countries (Google) does not name countries. |
| AI Mode | Yes | Kenya is on the country list (Search Help). Google launched AI Mode in Africa on 21 August 2025 (Google Africa blog). |
| Languages | English and Swahili are supported | Both help pages list the languages separately from countries, so neither confirms which applies in Kenya. |
| Ads in AI Overviews and AI Mode | Yes, in English | Kenya is on the country list (Google Ads Help). |
Search Console counts AI Overview and AI Mode appearances inside its normal Web search figures. For what AI answers say about your brand, see AI mentions, citations and visits.
Measured: Availability as listed on 19 November 2026 · Published: Google help pages are updated without dates · Last checked: 19 November 2026 · Source: Google Search Help and Google Ads Help (linked above)
Where digital advertising money goes
CA’s audience report tracks what brands spend on digital advertising each month and which platforms take it. Shares move a lot from quarter to quarter.
Kenya statistics · advertising
Digital ad spend peaked at KES 4.65 billion in September 2025 and fell to 1.67 billion in November and December
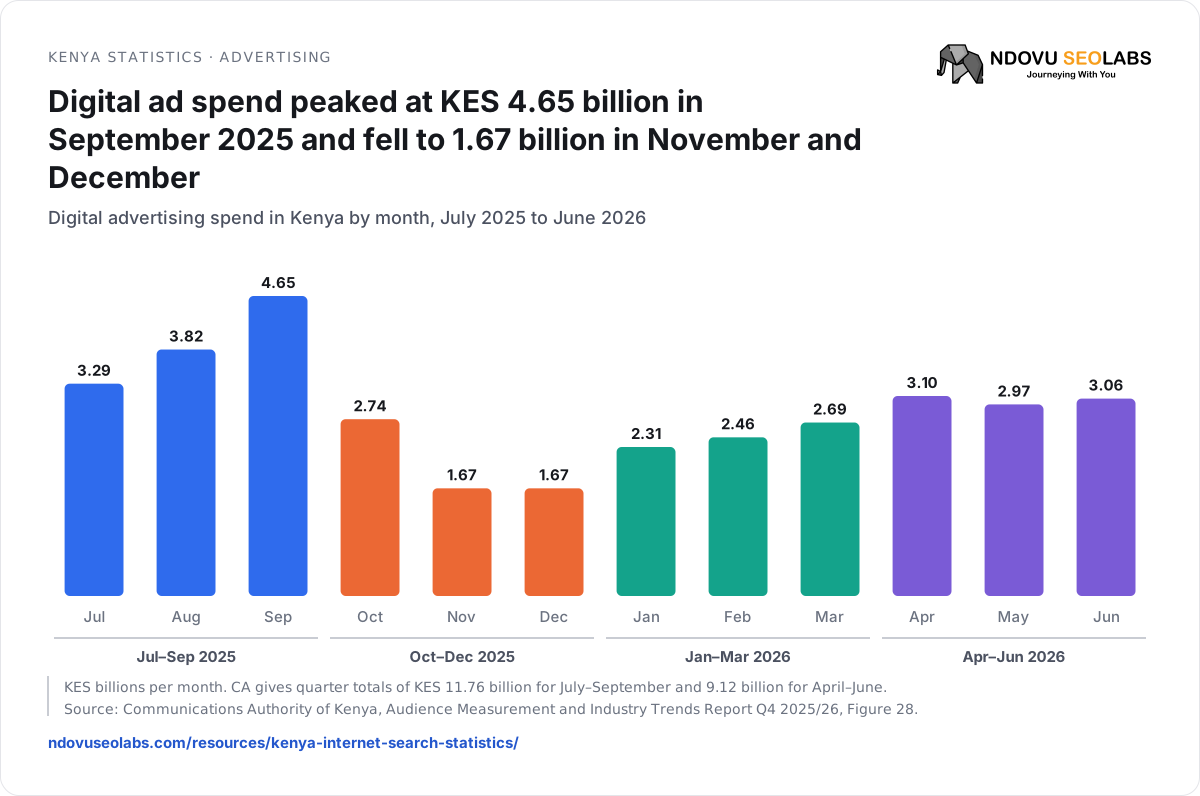
KES billions
KES billions per month. CA gives quarter totals of KES 11.76 billion for July–September and 9.12 billion for April–June.
Source: Communications Authority of Kenya, Audience Measurement and Industry Trends Report Q4 2025/26, Figure 28.
Kenya statistics · advertising
Facebook’s share of digital ad spend jumped from 29% to 63% in a single quarter
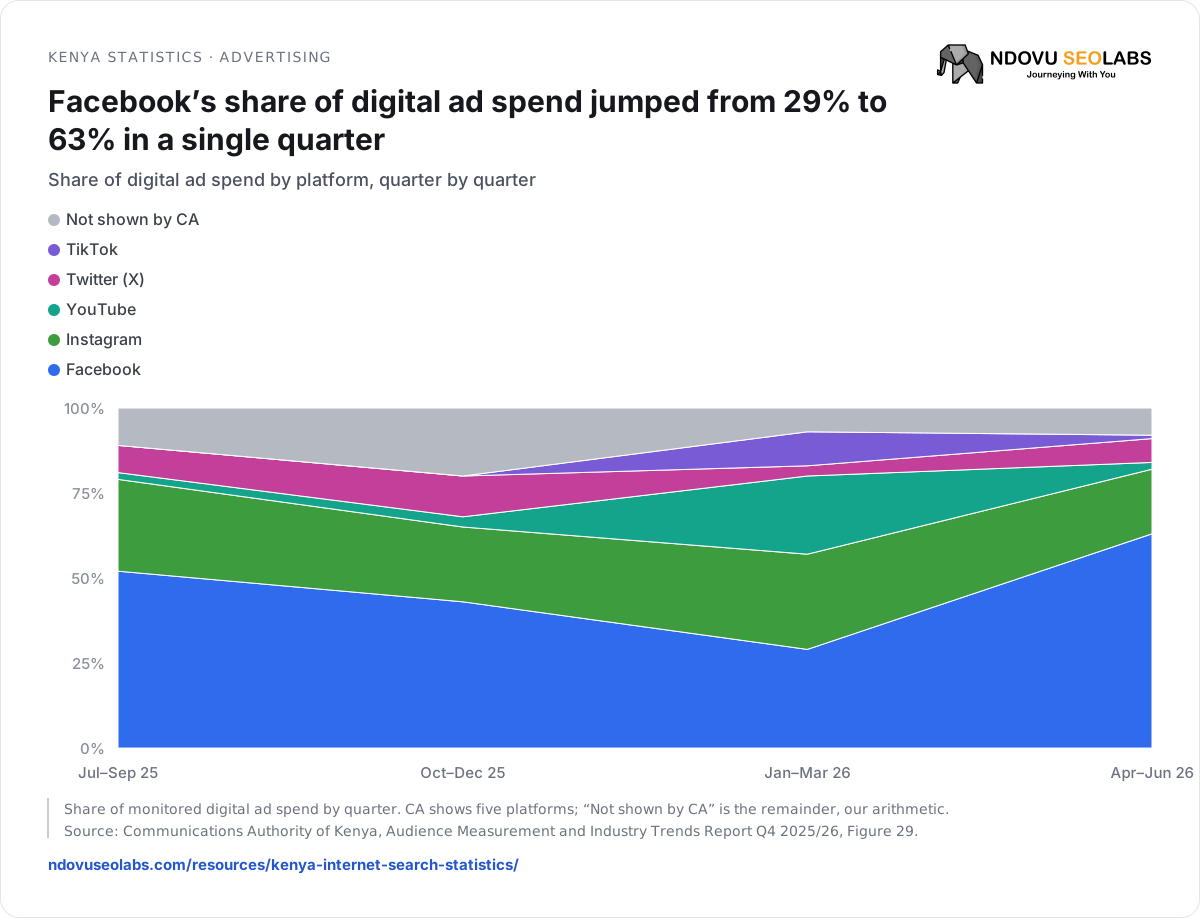
- Not shown by CA
- TikTok
- Twitter (X)
- YouTube
Share of digital ad spend
Share of monitored digital ad spend by quarter. CA shows five platforms; “Not shown by CA” is the remainder, our arithmetic.
Source: Communications Authority of Kenya, Audience Measurement and Industry Trends Report Q4 2025/26, Figure 29.
Kenya statistics · advertising
Facebook took 63% of Kenya’s digital ad spend in April–June 2026
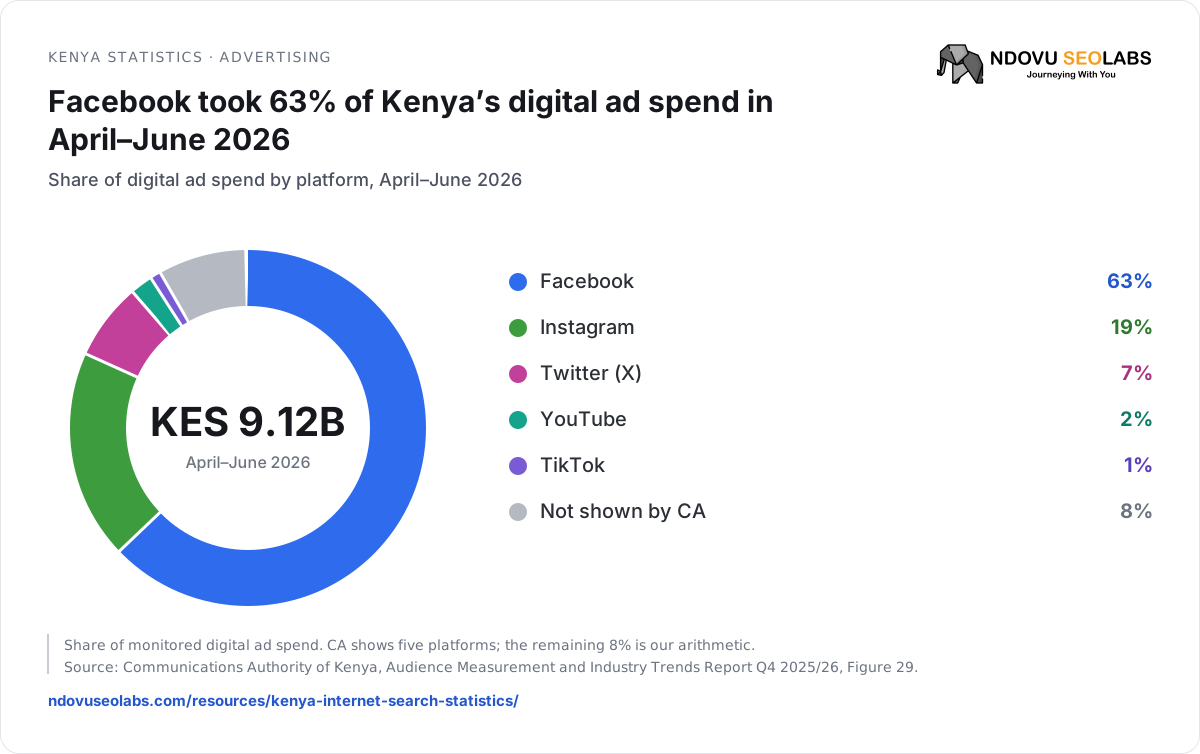
KES 9.12BApril–June 2026
- Facebook63%
- Instagram19%
- Twitter (X)7%
- YouTube2%
- TikTok1%
- Not shown by CA8%
Share of monitored digital ad spend. CA shows five platforms; the remaining 8% is our arithmetic.
Source: Communications Authority of Kenya, Audience Measurement and Industry Trends Report Q4 2025/26, Figure 29.
| Platform | Jul–Sep 2025 | Oct–Dec 2025 | Jan–Mar 2026 | Apr–Jun 2026 |
|---|---|---|---|---|
| 52% | 43% | 29% | 63% | |
| 27% | 22% | 28% | 19% | |
| Twitter (X) | 8% | 12% | 3% | 7% |
| YouTube | 2% | 3% | 23% | 2% |
| TikTok | 0% | 0% | 10% | 1% |
| Total spend | KES 11.76B | KES 6.08B* | KES 7.46B* | KES 9.12B |
* Sum of CA’s monthly figures. Shares are of monitored digital ad spend; CA does not say how spend is measured or which platforms make up the rest. Quote the quarter with the share: Facebook’s share ranged from 29% to 63% in one year.
Measured: July 2025–June 2026, by month and quarter · Published: August 2026 · Last checked: 19 November 2026 · Source: CA Audience Measurement and Industry Trends Report Q4 2025/26 (Figures 28–29, pp. 36–37)
Yearly overview estimates
DataReportal’s yearly Kenya report is the source most often quoted. Each number comes from another source, named in the last column.
| Figure | Value | Unit | Underlying source |
|---|---|---|---|
| Population | 58.9 million | People | United Nations |
| Cellular mobile connections | 85.5 million (145%) | Connections, excluding IoT | GSMA Intelligence |
| Internet users | 23.9 million (40.6%) | People, estimated | Estimate from ITU, GSMA Intelligence, ad tools and government data |
| Social media user identities | 23.9 million | Accounts, not people | Ad tools of the platforms |
| Median fixed download speed | 25.86 Mbps | Speed | Ookla |
DataReportal warns these figures are not directly comparable with its earlier reports. Its social media figure equals 100.1% of internet users and TikTok’s adult ad reach, which it flags as possibly implausible.
Kenya statistics · overview
An estimated 35.0 million Kenyans, 59.4%, were offline in October 2026
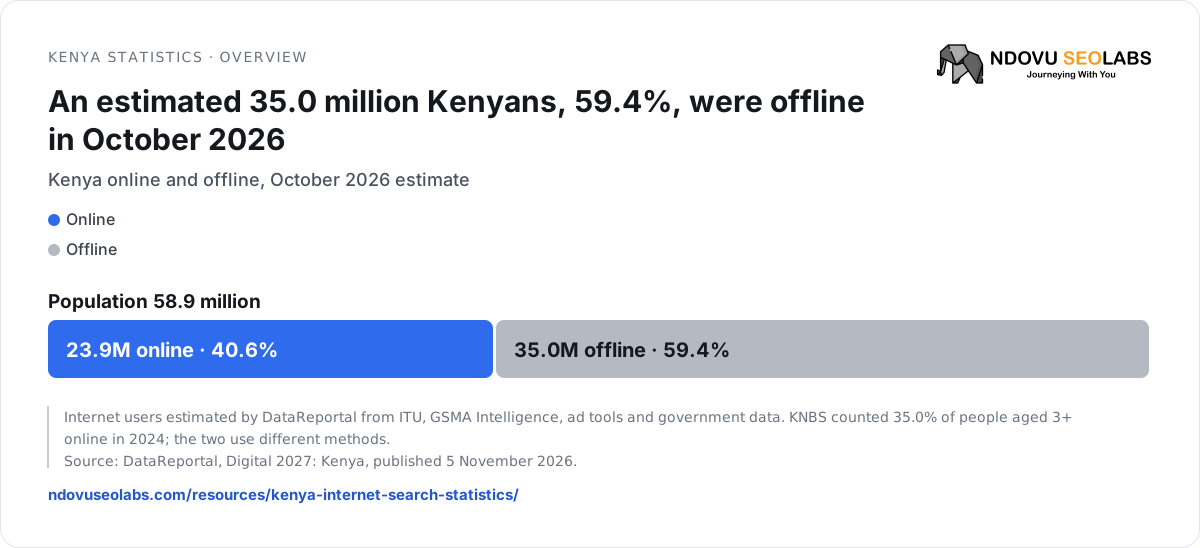
Internet users estimated by DataReportal from ITU, GSMA Intelligence, ad tools and government data. KNBS counted 35.0% of people aged 3+ online in 2024; the two use different methods.
Source: DataReportal, Digital 2027: Kenya, published 5 November 2026.
Measured: October 2026 · Published: 5 November 2026 · Last checked: 19 November 2026 · Source: DataReportal, Digital 2027: Kenya
Same question, different answers
These figures do not contradict each other. They answer different questions, so never join them into one series.
| Question | Answer | Source and period |
|---|---|---|
| How many mobile lines? | 88.0 million SIMs | CA, June 2026 |
| 85.5 million connections | GSMA Intelligence via DataReportal, late 2026 | |
| How many people have a phone? | 53.7% of people aged 3+ | KNBS, 2024 |
| How many internet connections? | 64.3 million mobile data SIMs and 2.8 million fixed lines | CA, June 2026 |
| How many people use the internet? | 35.0% of people aged 3+ | KNBS, 2024 |
| 23.9 million people, 40.6% of the population | DataReportal estimate, October 2026 | |
| Which search engine sends visits? | Google 97.2%, Bing 2.3% | StatCounter, October 2026 |
| Mobile or desktop? | Mobile 52.6% of page views, but 29–54% over 12 months | StatCounter, October 2026 |
| Mobile 55.3% of human web requests | Cloudflare Radar, 24 Oct–17 Nov 2026 | |
| 98.9% of people surveyed go online by phone | CA audience survey, April–June 2026 | |
| Where does ad money go? | Facebook 63% of digital ad spend | CA, April–June 2026 |
For your own site, the most accurate answer is your own data: Search Console for Google searches from Kenya, and Bing Webmaster Tools for Bing.
How this page is kept current
| Source | Next edition | When we update |
|---|---|---|
| CA Sector Statistics Report | July–September 2026 quarter, not yet published | When CA publishes each quarter |
| StatCounter | November 2026, monthly | Each quarter, after the 45-day revision |
| KNBS household ICT survey | Not announced | When a new survey is published |
| KNBS Economic Survey | 2027 edition | On publication |
| CA Audience Measurement report | July–September 2026 quarter | When CA publishes each quarter |
| DataReportal | Digital 2028, yearly | On publication |
We review the whole page every quarter. Each table keeps its own period, publication date and check date, and we note any correction we make to a source’s own figures.
Sources
- Communications Authority of Kenya: sector statistics reports
- CA: Sector Statistics Report, fourth quarter 2025/26 (April–June 2026)
- CA: Sector Statistics Report, fourth quarter 2024/25 (April–June 2025)
- CA: ICT Indicators Manual 2019 (definitions)
- KNBS and CA: Analytical Report on ICT based on the 2023/24 Kenya Housing Survey
- KNBS: Economic Survey 2026
- StatCounter Global Stats and its FAQ on methodology
- CA: Audience Measurement and Industry Trends Report, fourth quarter 2025/26
- DataReportal: Digital 2027: Kenya
- Ookla: Speedtest Global Index, Kenya
- Cloudflare Radar: Kenya traffic
- Google Search Help: AI Overviews countries, AI Mode countries and Google Ads Help: ads in AI experiences
- geoBoundaries: Kenya county boundaries (RCMRD, public domain)
- Google: update on country code top-level domains (15 April 2025)