

Ndovu research on 14 Kenyan websites: how much bot data went on 404, 403, 429 and 5xx responses, which crawlers received it, and why stores were hit hardest.
Across 14 Kenyan websites, error responses were 3.5% of bot requests and 1.8% of the data bots received: about 4.6 GB in four days. That small total hides a big spread. On the average website errors took 12.8% of bot data, and on 4 of 8 online stores they took more than a fifth.
Key findings
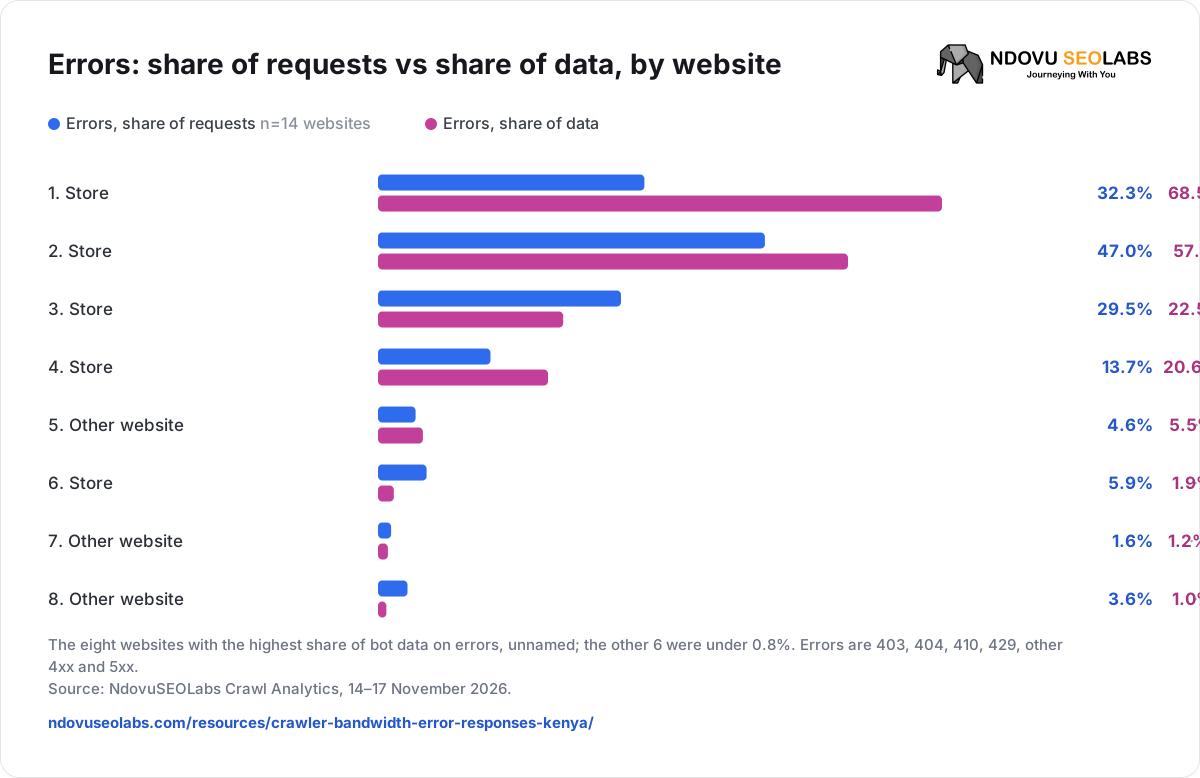
- 32% → 68%one website’s error share of requests against its error share of data: an error rate is not an error bandwidth.
- 21% vs 0.4%of bot data went on errors on the average store and the average content site.
- 40%of all error data went to Bytespider, and every byte it received was an error.
- 81%of error requests came from verified crawlers: most errors reached real search and AI bots.
Fourth in Ndovu’s bot research series. The sample and method are in which bots crawl Kenyan websites; total bot data is in which bots use the most bandwidth.
What counts as an error
| Response | In the error figures? | Why |
|---|---|---|
| 404, 410 | Yes | The page is missing or removed. |
| 403, 401, 429 | Yes, reported apart | Refused or rate-limited: may be on purpose. |
| 500–599 | Yes | The server failed. |
| 301, 302, 307, 308 | No, reported apart | Redirects; they record no body here. |
| 304 | No | A cache check; it cannot carry content (RFC 9110). |
| 200 showing an error page | Not visible | A “soft 404”; Google finds these from the content (Google), status codes alone cannot. |
Error data is the response size each server logged for those responses: exact sums per status, never estimated from an error rate. Origin server logs only; requests a CDN answers never reach them.
An error rate is not an error bandwidth
Multiplying an error rate by total bandwidth assumes error pages are the same size as everything else. They rarely are:
| Response | Requests | Data | Average response |
|---|---|---|---|
| Success (2xx) | 1,554,129 | 245.5 GB | 158 KB |
| Not found (404, 410) | 18,037 | 4.0 GB | 221 KB |
| Forbidden (403) | 3,119 | 0.6 GB | 191 KB |
| Too many requests (429) | 31,980 | 0.0 GB | 0.3 KB |
| Server error (5xx) | 4,382 | 0.0 GB | 0.4 KB |
Table 1. Bot responses by status across 14 websites. Source: NdovuSEOLabs Crawl Analytics, 14–17 November 2026.
A 404 averaged 221 KB, more than a success. A 429 averaged 0.3 KB. So a website whose errors are mostly 404s loses more data than its error rate suggests, and one whose errors are mostly 429s loses almost none.
Errors: share of requests vs share of data, by website


- Errors, share of requests n=14 websites
- Errors, share of data
The eight websites with the highest share of bot data on errors, unnamed; the other 6 were under 0.8%. Errors are 403, 404, 410, 429, other 4xx and 5xx.
Source: NdovuSEOLabs Crawl Analytics, 14–17 November 2026.
Stores were hit hardest
| Websites | Error share of bot data, average | Median | Error data per site per day, median | |
|---|---|---|---|---|
| All websites | 14 | 12.8% | 1.1% | 13 MB |
| Ecommerce | 8 | 21.4% | 11.3% | 24 MB |
| Content and tools | 3 | 0.36% | 0.03% | 7 MB |
Table 2. Each website’s error share of bot data, then the average and median across websites. Pooled across all websites the share is 1.8%, because the busiest websites had few errors. Source: NdovuSEOLabs Crawl Analytics, 14–17 November 2026.
On stores, the failed requests were mostly images (6,752) and product pages (4,644), then generated comparison and category pages: most likely URLs that no longer exist but are still linked or remembered. On a small store with modest bot traffic, those full error pages can outweigh the real pages bots fetch. Content sites barely registered.
Which bots received the error data
| Bot | Error data | Share of all error data | Errors, share of its requests | Errors, share of its data |
|---|---|---|---|---|
| Bytespider | 1,821 MB | 39.6% | 99.1% | 100.0% |
| Meta-ExternalAgent | 1,180 MB | 25.7% | 10.1% | 3.6% |
| Googlebot | 276 MB | 6.0% | 2.2% | 2.4% |
| Bingbot | 224 MB | 4.9% | 2.6% | 4.3% |
| PetalBot | 198 MB | 4.3% | 3.9% | 4.9% |
| Meta-WebIndexer | 140 MB | 3.1% | 3.3% | 5.3% |
Table 3. The six bots that received the most error data. Source: NdovuSEOLabs Crawl Analytics, 14–17 November 2026.
- Bytespider got errors on 99.1% of its requests across 12 websites; none could be verified as ByteDance. Blocking it at the server or CDN, before the theme renders, would remove most of this data.
- Meta-ExternalAgent received 26% of error data, almost all of it 404 pages; its many 429s cost almost nothing.
- Storebot-Google spent 32% of its data on errors, almost all 404s for missing scripts and styles on stores.
What each error type tells you
| Status | What we saw | What it means |
|---|---|---|
| 404 | 18,037 requests, 4.0 GB, the bulk of error data. | Bots still find removed URLs. Fix the links and sitemaps that list them; keep the 404. |
| 403 | 3,119 requests, 89% to Bytespider. | Deliberate blocks, but served as full pages. Block earlier and cheaper. |
| 429 | 31,980 requests: GPTBot 17,006 on 9 websites, Meta-ExternalAgent 12,236 on 10. | The server rate-limiting busy AI crawlers. Cheap in data, but Google reads 429 as overload (Google); check Googlebot is never limited. |
| 5xx | 4,382 requests, 88% from Baiduspider on 1 website, with empty bodies. | A server failing for one crawler. Little data, but a real fault to fix. |
Google advises against using 401 or 403 to slow crawling; other 4xx responses do not change its crawl rate (Google).
Bots that received nothing but errors
Of 539 bot-and-website pairs, 34 got only errors: 9,949 requests on 11 websites, still 0.7 GB of data. Two names made up 99% of those requests: Bytespider (5,974) and Baiduspider (3,856).
A bot that never gets a useful page is a candidate for a robots.txt rule or a block, if you do not want it. If you do, the errors are the thing to fix.
Measure it on your own website
| Do | Avoid |
|---|---|
| Sum the bytes logged against 4xx and 5xx responses, divided by all bot bytes, from the same log and period. | Error rate × total bandwidth. |
| Report error data per day as well as the share; a share can rise while the data falls. | Reading a falling share as an improvement on its own. |
| Treat zero bytes as what they are: redirects, 304s and many 429s and 5xx have no body. | Treating a zero as missing data, or missing data as zero. |
| Use full totals. Ndovu’s Activity view samples errors first, so it overstates them. | Computing shares from a sample of recent requests. |
| Keep CDN and origin figures apart. | Adding edge and origin bytes for the same request. |
What to fix first
- Errors on pages that should work. A product or category returning an error costs visibility, whatever its size.
- Old links that keep producing 404s. Find where bots discover them (menus, sitemaps, feeds, other sites) and update the source.
- Heavy error pages. A lighter 404 template, and blocks applied at the server or CDN instead of inside WordPress.
- Filters that create empty pages. Return a 404 for empty combinations (Google) and stop linking them; see filtered URL crawling.
Never “fix” an error rate by returning 200 for missing pages; that hides the problem and creates soft 404s. Measure the same URLs and source again after each change. Ndovu’s Crawl Analytics breaks bot traffic down by response, bot and page.
Method and limitations
| How it works | |
|---|---|
| Sample | 14 Kenyan websites with server access logs, monitored by NdovuSEOLabs; not a random sample. |
| Period | 14–17 November 2026: four complete days in Kenyan time. A pilot; later editions use 28 days. |
| Errors | 403, 404, 410, 429, other 4xx and 5xx. Redirects, 304s and soft 404s are not counted. |
| Data | The access log’s response-size field (body without headers), summed per status. GB = 10⁹ bytes. |
| Shares | Pooled: error bytes ÷ all bot bytes. Average and median: each website’s share first. NdovuBot excluded; unverified agents included. |
| Not measured | Which URLs failed, why bots requested them, CDN responses, hosting cost and long-term trends. |
Original research by NdovuSEOLabs, from Crawl Analytics data. You may cite these figures with a link to this page.