

Bing impressions rose and clicks fell. Split the change by query, page, CTR and position to find the stories behind the totals before you act.
Your Bing report shows impressions up 50% on the previous period and clicks down a third. Average CTR has halved.
It is tempting to blame titles, AI answers or a Bing update. The totals can’t tell you which, and often the answer is several things at once.
The short version. Don’t pick a cause from the totals. Split the change four ways: which queries, which pages, which click-through rates and which positions moved. A site-wide rise in impressions is usually a few page-level stories added together, and each needs its own response.
Why the totals mislead
Average CTR is total clicks ÷ total impressions. If Bing starts showing you for broad searches that rarely click, impressions jump and CTR falls, even if no page got worse. At the same time, a real loss on one important query can hide inside the same totals.
So the two numbers may not be one problem. The rise in impressions and the fall in clicks can come from different queries and different pages.
Make the periods comparable first
- Compare equal periods. Bing’s query and page rows arrive in weekly buckets, so use whole weeks where you can.
- Check the comparison exists. If the previous period wasn’t fully stored, changes are not real changes yet.
- Separate a seasonal pattern from a new one. Bing Webmaster Tools keeps 16 months of search performance data, so you can check the same weeks last year there (Bing).
- Bing’s report covers more than classic web results: it includes chat and Copilot responses, news, images and videos, and can be filtered by page, country, device and date (Bing). Check whether the change sits in one of these.
Four checks, in order
| Check | Question | What to look for |
|---|---|---|
| 1. Query mix | Which queries brought the new impressions, and which lost clicks? | New broad or informational queries; branded queries holding or falling; one query family moving together. |
| 2. Affected pages | Which pages gained impressions, and which lost clicks? | Whether gains and losses sit on the same pages or different ones; one section of the site doing most of the moving. |
| 3. CTR per row | Did CTR fall on the same queries, or did low-CTR queries just get bigger? | A query whose impressions held but clicks fell is a different finding from a new query that rarely clicks. |
| 4. Where pages appear | Did position change, or did a different page start showing? | Average position dropping on important queries; Bing showing a different URL than before; crawl issues on the pages that lost clicks. |
Work from absolute change, not percentages. +900% on 50 impressions matters less than −40% on 4,000.
Example: one total, three stories
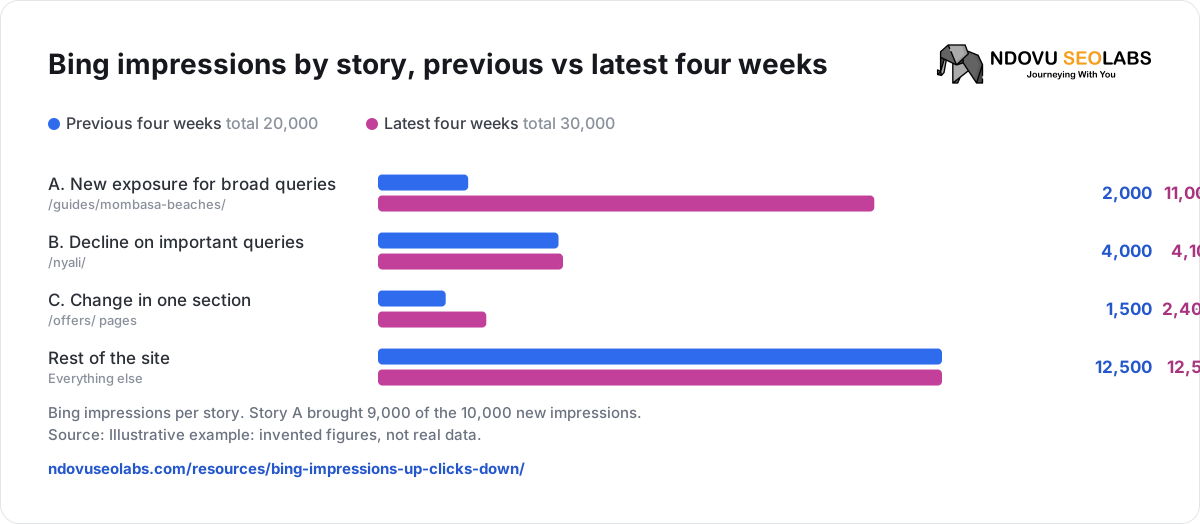
Illustrative example, not real data. An invented Mombasa holiday-rental site on example.co.ke. Two four-week periods of Bing data. Totals: impressions 20,000 → 30,000 (+50%), clicks 900 → 610 (−32%), CTR 4.5% → 2.0%.
| Story | Queries and pages | Impressions | Clicks | Avg. position | Reading |
|---|---|---|---|---|---|
| A. New exposure for broad queries | “mombasa beaches”, “things to do in mombasa” → /guides/mombasa-beaches/ | 2,000 → 11,000 | 60 → 70 | 14 → 7 | Bing now shows the guide for broad research searches. Few click, and that is normal for them. Nothing broke. |
| B. Decline on important queries | “holiday apartments nyali”, “nyali apartments for rent” → /nyali/ | 4,000 → 4,100 | 420 → 250 | 2 → 4 | Same demand, fewer clicks, lower position. This is the real loss. |
| C. Change in one section | /offers/ pages, mostly for “cheap hotels mombasa” | 1,500 → 2,400 | 200 → 70 | 6 → 5 | Bing shows offer pages for a hotel search, and the offers on them have ended. Wrong page, stale content. |
| Rest of the site | Everything else | 12,500 → 12,500 | 220 → 220 | Flat | No change. |
Bing impressions by story, previous vs latest four weeks


- Previous four weeks total 20,000
- Latest four weeks total 30,000
Bing impressions per story. Story A brought 9,000 of the 10,000 new impressions.
Source: Illustrative example: invented figures, not real data.
Bing clicks by story, previous vs latest four weeks
- Previous four weeks total 900
- Latest four weeks total 610
Bing clicks per story. Stories B and C lost 300 clicks between them; story A gained 10.
Source: Illustrative example: invented figures, not real data.
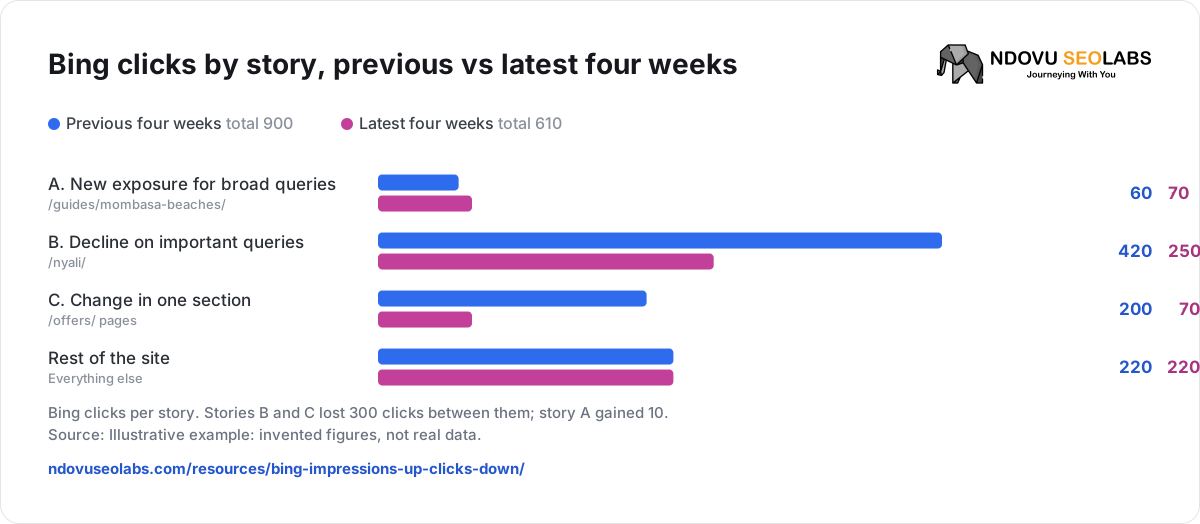
Story A brought 90% of the new impressions but added clicks. Stories B and C lost all the clicks and added only 1,000 impressions between them. Rewriting every title on the site would have missed both.
| Story | Do | Don’t |
|---|---|---|
| A | Check the guide answers those searches and links to the right listings. Then leave it. | Treat its low CTR as a fault. |
| B | Open the query: compare the pages Bing showed before and after, check Google for the same query, and look for crawl issues on /nyali/. Then review the title and description. | Change several things at once; you won’t know what worked. |
| C | Remove or update expired offers, and make sure the hotel listings are the pages that answer hotel searches. | Redirect every offer to the homepage. |
In Ndovu
Open Search Performance and choose Bing next to Search engine. Pick Last 7 days, Last 28 days, Last 3 months or Last 6 months; each ends on the last day Bing reported.
| Check | Where | Note |
|---|---|---|
| Totals | Tiles Total clicks, Total impressions, Average CTR | Daily figures. If “The previous period isn’t fully stored yet” shows, there is no change to read. |
| Query mix | Queries, sorted by Impressions; Growing & declining → Queries gaining / Queries losing | Rows are weekly buckets. A query whose clicks fell is listed under losing even if its impressions rose. |
| Affected pages | Pages; Pages gaining / Pages losing | Clicks and Impressions each show their change. |
| CTR | The CTR column; Opportunities | Opportunities lists queries with at least 50 impressions and CTR under 2%. Where Bing reports more clicks than impressions, no CTR is shown. |
| Position | Avg. position; the panel icon → Keyword details → Your site in Bing | Bing reports whole numbers per row, weighted by impressions. Keyword details shows daily Bing clicks and impressions against the period before, and the pages Bing showed. |
| Crawl | Crawl & index | Bing’s own crawl issues for each URL, such as 301 redirect or 4xx error. |
| Google vs Bing | All available; Indexing → Google vs Bing | A fall on both engines points to the page; a fall on Bing alone points to how Bing shows it. Impressions and positions are never added across engines. |
Bing needs to be connected first. Bing data is kept apart from Google’s.
Check the result
- Note each change and its date, per story.
- Compare the same queries and pages, over the same period length, after whole Bing weeks have reported.
- Story B worked when clicks on those queries recover and position returns. Story C worked when hotel searches show hotel pages and the old offers stop appearing.
- Expect the site-wide CTR to stay lower while story A continues. That is not a failure.
A worksheet you can copy
Periods compared (equal length, whole weeks):
Totals: impressions __ → __ | clicks __ → __ | CTR __ → __

Story 1
  Queries:
  Pages:
  Impressions before → after:
  Clicks before → after:
  Avg. position before → after:
  Same on Google? (yes / no):
  Reading (new exposure / real loss / wrong page / crawl issue):
  Action and date:

Story 2 …

Share of the impression change explained:
Share of the click change explained:| When you need to… | Read |
|---|---|
| Read every Bing view | Read your Bing reports |
| Connect Bing | Connect Bing Webmaster Tools |
| Compare with Google | Read the Search Performance report |
Sources
- Bing Webmaster Blog: Bing Webmaster Tools or Google Search Console
- Bing Webmaster Blog: Search Performance data extended to 16 months