

Ndovu research on 14 Kenyan websites: which crawlers received the most data, why requests and data rank bots differently, and how much went on errors.
Across 14 Kenyan websites, bots received 250.1 GB of responses in four days. Applebot, GPTBot and Meta-ExternalAgent received the most: 22%, 21% and 13% of it.
But the typical website saw a different picture. Applebot’s share on the median website was 0.27%, and a crawler’s request count is a poor guide to how much data it takes.
Key findings
- 82.1%of all bot data went to three websites.
- 8th → 5thGooglebot’s rank by requests and by data; its average response was 292 KB.
- 221 KBthe average “not found” page, more than a successful response (158 KB).
- 13.8 GB vs 0.3 GBbot data a day for the median content site and the median store.
Third in Ndovu’s bot research series, after which bots crawl Kenyan websites and how bots crawl ecommerce websites.
What “bandwidth” means here
We measure the response size recorded in each website’s server access log: the size field of the standard log format, which Apache defines as the response size without headers, not the exact bytes sent over the network (Apache). Redirects and 304 “not modified” responses record no body, so they count as zero.
- Origin only. 14 websites with server logs, 56 website-days. Requests a CDN answers from its cache never reach the server, so they are not here.
- Bots only. All crawlers and automated agents except our own NdovuBot. 85.3% of the data went to verified crawlers.
- Not a bill. Hosting and CDN plans meter differently and include allowances, so this does not convert to shillings.
Which bots received the most data
| Bot | Data | Share of data | Share of requests | Average response |
|---|---|---|---|---|
| Applebot | 54.9 GB | 22.0% | 23.3% | 141 KB |
| GPTBot | 51.9 GB | 20.7% | 20.9% | 149 KB |
| Meta-ExternalAgent | 32.9 GB | 13.1% | 11.0% | 178 KB |
| Amazonbot | 15.0 GB | 6.0% | 7.5% | 120 KB |
| Googlebot | 11.7 GB | 4.7% | 2.4% | 292 KB |
| ClaudeBot | 10.5 GB | 4.2% | 3.3% | 187 KB |
| ShapBot | 7.5 GB | 3.0% | 2.6% | 172 KB |
| Bingbot | 5.3 GB | 2.1% | 1.7% | 184 KB |
| AhrefsBot | 5.1 GB | 2.1% | 0.9% | 343 KB |
| Meta-ExternalAds | 5.1 GB | 2.0% | 5.4% | 56 KB |
Table 1. The ten named bots that received the most recorded data across 14 websites. Shares use all 250.1 GB and all 1,669,357 external requests, including unnamed agents (“other self-declared bots” took 6.6% of data). Source: NdovuSEOLabs Crawl Analytics, 14–17 November 2026.
More requests do not mean more data
More requests do not mean more data


- Share of requests n=1,669,357
- Share of data n=250.1 GB
Bots that fetch large pages take more data than their request count suggests; bots that fetch small files take less. Data is the access log’s response size (body, no headers).
Source: NdovuSEOLabs Crawl Analytics, 14–17 November 2026.
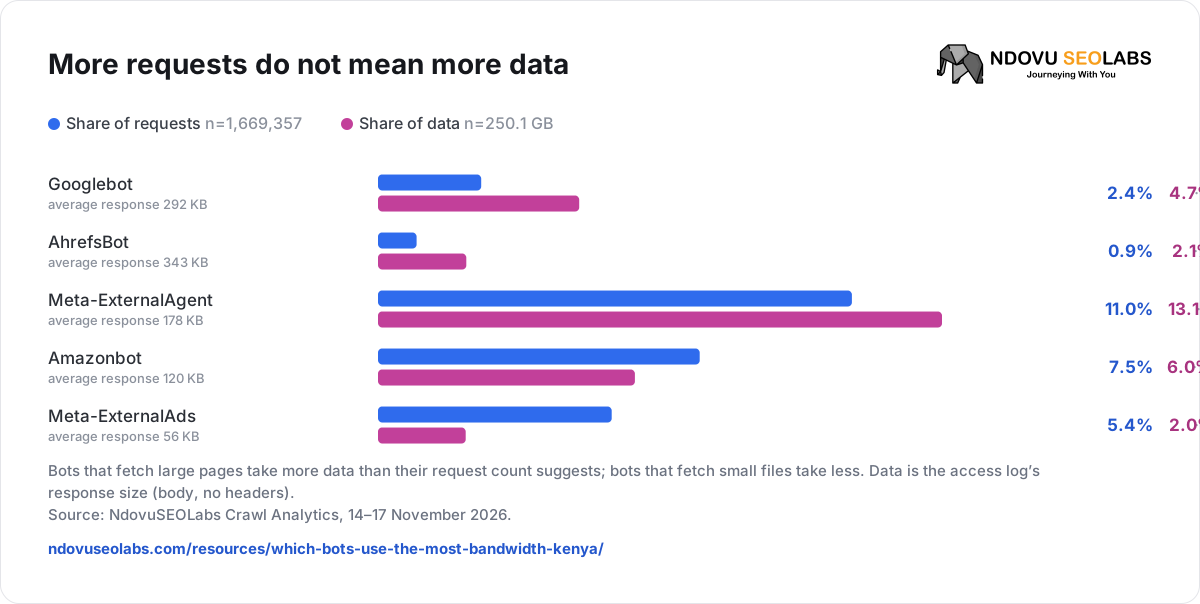
Googlebot’s average response was 292 KB and AhrefsBot’s 343 KB, against 150 KB for all bots. Meta-ExternalAds went the other way: 5.4% of requests but 2.0% of data, at 56 KB a response. To find the bot behind a bandwidth rise, rank by data, then look at what it fetched.
The busiest bot overall is rarely the busiest on your site
Share of all bot data vs average share per website
- Share of all bot data n=250.1 GB
- Average share per website n=14 websites
The average per website gives each website one vote, with zero where a bot was absent.
Source: NdovuSEOLabs Crawl Analytics, 14–17 November 2026.
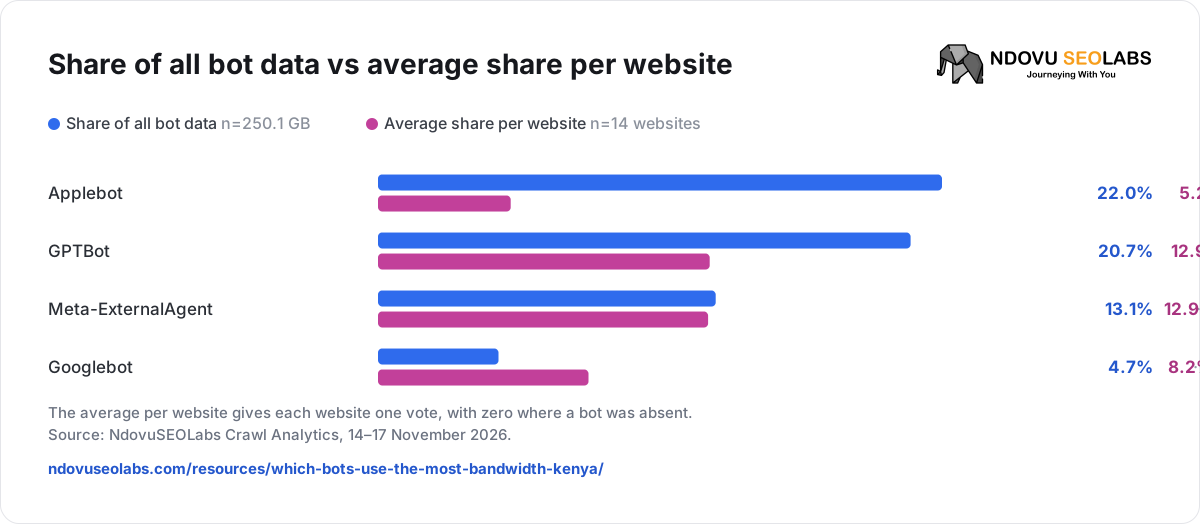
86% of Applebot’s data went to one website. Give every website equal weight and its share falls to 5.2%; GPTBot (12.9%) and Meta-ExternalAgent (12.9%) lead instead, and Googlebot rises to 8.2%.
Bot data is uneven between websites too: the mean website received 4.5 GB a day, the median 0.7 GB.
Content sites and stores
| Websites | Bot data per site per day (median) | Mean | Biggest bot on the average site | |
|---|---|---|---|---|
| Content and tools | 3 | 13.8 GB | 12.8 GB | GPTBot (47%) |
| Ecommerce | 8 | 0.3 GB | 2.3 GB | Meta-ExternalAgent (19%) |
Table 2. Bot data by sector, server-log websites only. Real estate and services have too few comparable websites. Source: NdovuSEOLabs Crawl Analytics, 14–17 November 2026.
Content and tools websites drew far more bot data per website, led by GPTBot. On stores, the data followed the page type:
| Store page type | Share of page data | Average response |
|---|---|---|
| Generated comparison pages | 38% | 413 KB |
| Product pages | 38% | 385 KB |
| Category and shop pages | 13% | 134 KB |
| Images | 6% | 85 KB |
| Homepage | 1% | 81 KB |
| Scripts, styles and fonts | 1% | 34 KB |
| API and AJAX | 0% | 5 KB |
Table 3. Recorded data by page type on 8 stores, named bots only. Comparison pages are a generated URL family on two stores; see the ecommerce study. Source: NdovuSEOLabs Crawl Analytics, 14–17 November 2026.
How much went on errors
| Response | Requests | Data | Average response |
|---|---|---|---|
| Success (2xx) | 1,554,129 | 245.5 GB | 158 KB |
| Redirect (3xx) | 53,949 | 0.0 GB | 0 KB |
| Not found (404, 410) | 18,037 | 4.0 GB | 221 KB |
| Forbidden (403) | 3,119 | 0.6 GB | 191 KB |
| Too many requests (429) | 31,980 | 0.0 GB | 0 KB |
| Server error (5xx) | 4,382 | 0.0 GB | 0 KB |
Table 4. Bot responses by status across 14 websites. Source: NdovuSEOLabs Crawl Analytics, 14–17 November 2026.
Errors were 3.5% of requests and 1.8% of data, about 4.6 GB. Small overall, but two details matter:
- A 404 page is not small. At 221 KB it averaged more than a successful response, a size that means full themed pages, not short messages. A lighter 404 template cuts the cost of every bad link a bot follows.
- Refusing cheaply works. 429 and 5xx responses averaged under 1 KB; 403s averaged 191 KB, a full page again. If you block a bot, block it before the theme renders.
- One name stood out on stores. Bytespider, almost all of whose requests failed, averaged 12.0% of a store’s bot data (median 0.2%): heavy on a few small stores, slight on the rest.
Redirects record no body but each one costs a request; a chain or loop multiplies that, and only a traced chain of targets proves a loop. Filtered and generated URLs cost data through successful responses, so they never show up as errors. For Google, 429 and 5xx slow crawling down (Google), and empty filter combinations should return a 404 (Google).
Find the bot behind your bandwidth
| Step | What to do |
|---|---|
| 1. Know the measure | Check whether the bytes come from the CDN, the server log or WordPress, and the period. Don’t mix them. |
| 2. Verify the bot | Separate verified crawlers from names in the user-agent (Google’s method). |
| 3. Rank by data, then by page | For the top bots, group bytes by section, status and file type: many pages, a few large files, or error pages? |
| 4. Fix the source | Remove stale links, shorten redirect chains, stop generating needless URLs, lighten 404 and 403 pages. |
| 5. Measure again | Same source, same URL groups, a comparable period. Check important pages still reach the crawlers you want. |
Ndovu’s Crawl Analytics shows requests and data by bot, response and page from your own logs.
Method and limitations
| How it works | |
|---|---|
| Sample | 14 Kenyan websites with server access logs monitored by NdovuSEOLabs; not a random sample. Plugin-only websites excluded. |
| Period | 14–17 November 2026: four complete days in Kenyan time. A pilot; later editions use 28 days. |
| Data | The access log’s response-size field: body size without headers, not bytes on the wire. Exact sums, not rounded dashboard values. GB = 10⁹ bytes, KB = 10³. |
| Shares | Share of data: a bot’s bytes ÷ all bot bytes. Average and median: the share on each website, then the mean or median, with zero where a bot was absent. |
| Page types | Stores only, by WooCommerce’s default URL patterns, named bots only. |
| Not measured | CDN traffic, human traffic, total website bandwidth, hosting cost and long-term trends. |
Original research by NdovuSEOLabs, from Crawl Analytics data. You may cite these figures with a link to this page.