

Ndovu research on eight Kenyan online stores: which bots crawled them, which pages they requested, and how filters, generated pages and errors used the crawls.
Eight Kenyan online stores recorded 332,783 bot requests in four days. The average store received 10,399 a day; the median store, 3,365. Most of that activity went to a few stores, and much of it went to filtered category pages and generated URLs rather than products.
Key findings
- 50.2%of all store bot requests went to one store; two stores took 75.4%.
- Meta-ExternalAgentwas the busiest named bot; Googlebot and Bingbot reached every store with verified requests.
- 88.7%of category-page requests carried filters, sorting or paging in the query string.
- 46,938generated comparison-page addresses drew 20.6% of page requests in four days.
- 98.7%of requests calling themselves Bytespider got an error.
This is the second article in Ndovu’s bot research series. The method and the wider sample are in Which bots crawl Kenyan websites?.
The stores in this study
11 online stores had data. The 8 with server access logs for 14–17 November 2026 are compared here: 32 store-days. The 3 with WordPress plugin data only see fewer requests, so they are left out. Most sell consumer electronics, computers, accessories or specialist equipment. Our own NdovuBot (3,123 requests) is excluded, and no store is named.
A few stores get most of the bot traffic
Bot requests per store per day


- Requests per day n=8 stores
- Mean 10,399
- Median 3,365
Each store’s four-day total ÷ 4, stores sorted and unnamed. The two busiest pull the mean far above the median. NdovuBot excluded.
Source: NdovuSEOLabs Crawl Analytics, 14–17 November 2026.
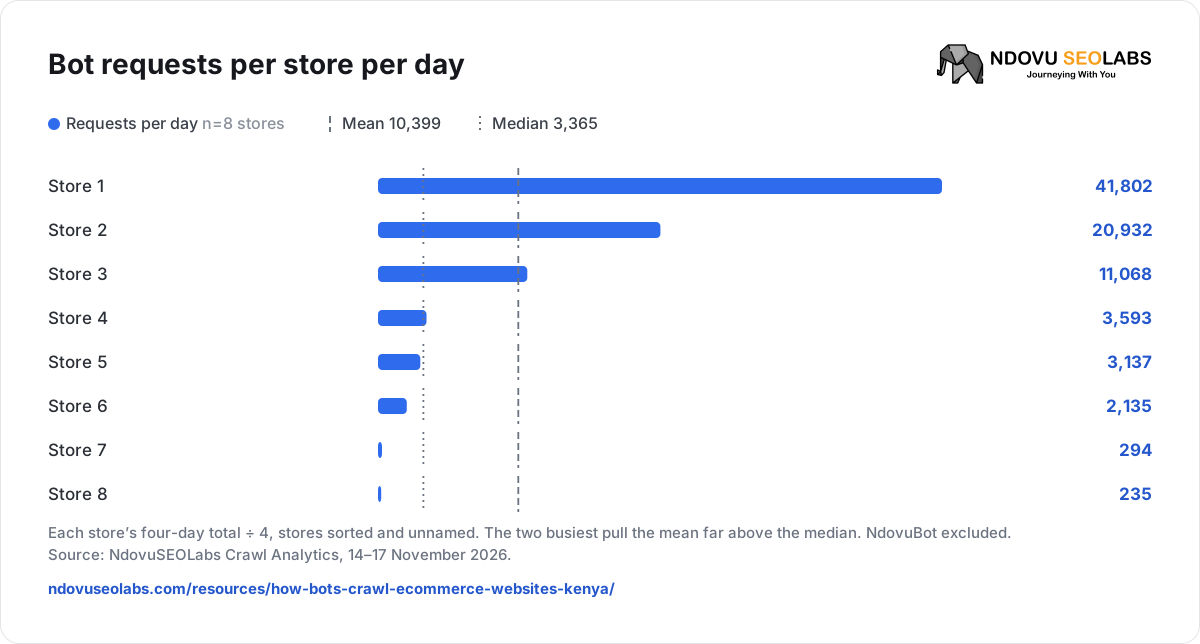
The busiest store received 50.2% of all requests. The mean of 10,399 a day describes almost no store; the median of 3,365 is closer to a typical shop. Neither is a target: request counts only mean something next to the size of the catalogue and the responses returned.
Which bots crawled the stores
| Bot | Requests | Share | Stores reached / verified | Verified |
|---|---|---|---|---|
| Meta-ExternalAgent | 85,375 | 25.65% | 7 / 7 | >99.9% |
| Meta-ExternalAds | 42,406 | 12.74% | 4 / 4 | 100.0% |
| ShapBot | 32,168 | 9.67% | 2 / – | No check |
| Googlebot | 30,501 | 9.17% | 8 / 8 | 99.4% |
| AhrefsBot | 12,831 | 3.86% | 8 / 8 | 92.7% |
| GPTBot | 12,820 | 3.85% | 7 / 6 | 99.9% |
| Bingbot | 11,383 | 3.42% | 8 / 8 | 99.8% |
| Meta-WebIndexer | 10,139 | 3.05% | 7 / 6 | 99.8% |
| PetalBot | 8,837 | 2.66% | 6 / 6 | 99.5% |
| RiverBot | 7,418 | 2.23% | 2 / 2 | 99.8% |
Table 1. The ten named bots with the most requests across 8 stores. Shares use all 332,783 requests. “Verified” means the request matched the operator’s published IP ranges or DNS (how Google describes it); “No check” means the operator publishes nothing to check a server log against. Source: NdovuSEOLabs Crawl Analytics, 14–17 November 2026.
81.6% of all store requests were verified. Meta’s two agents together made 38.4% of requests. ShapBot’s large total came from 2 stores only.
What a typical store sees
Share of all store requests vs average share per store
- Share of all requests n=332,783 requests
- Average share per store n=8 stores
The average per store gives each store one vote, with zero where a bot was absent.
Source: NdovuSEOLabs Crawl Analytics, 14–17 November 2026.
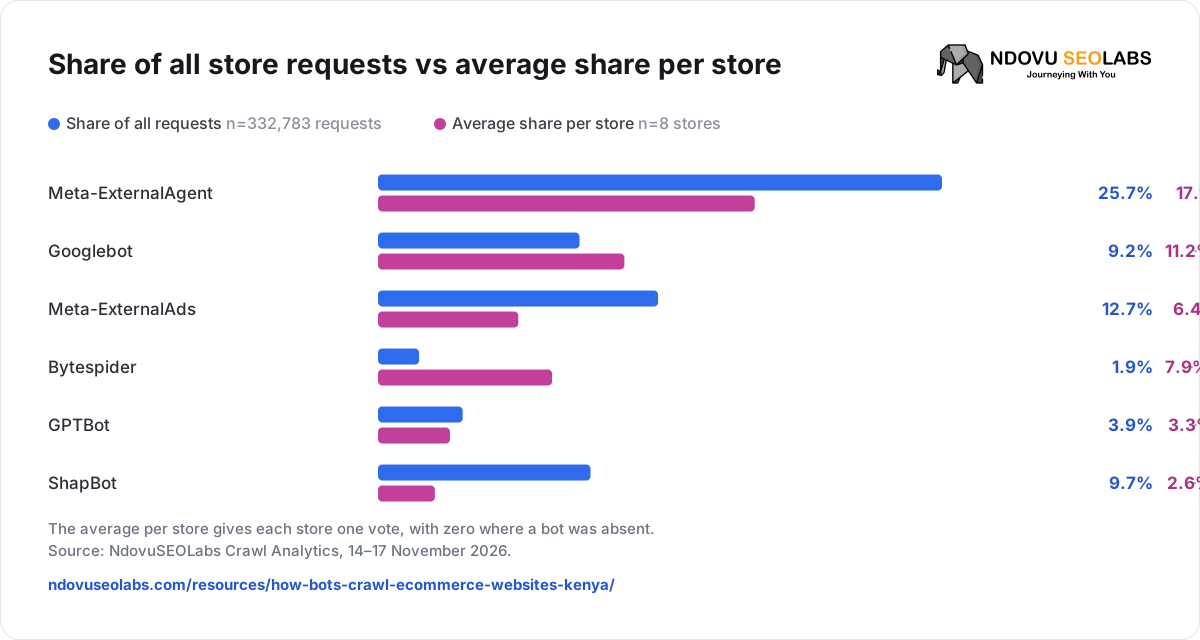
Meta-ExternalAgent still leads at 17.14% per store (median 12.35%), with Googlebot next at 11.21%. Bytespider moves the other way: 1.9% of all requests but 7.9% on the average store, because it is a large share of traffic on small stores. Meta-ExternalAds is the reverse: 12.7% overall, but a median store share of 0.25%.
Google is more than the Googlebot row
| Google agent | Requests | Stores with verified requests | Mostly requested |
|---|---|---|---|
| Googlebot | 30,501 | 8 of 8 | generated comparison pages, product pages |
| Googlebot-Image | 3,511 | 8 of 8 | images, product pages |
| AdsBot-Google | 3,422 | 6 of 8 | scripts, styles and fonts, API and AJAX |
| Storebot-Google | 3,222 | 4 of 8 | scripts, styles and fonts, images |
Table 2. Google’s agents on the 8 stores. Source: NdovuSEOLabs Crawl Analytics, 14–17 November 2026.
Storebot-Google checks shopping details such as price, availability and shipping, and Google says it may walk through checkout without buying (Google Merchant Center). In this window it requested scripts, images and API calls, and no cart or checkout pages. If a checkout appears in your logs without an order, verify the agent before blocking it.
Which pages the bots requested
Where bots went on stores: requests vs data, by page type
- Share of requests n=323,641
- Share of recorded data n=72.2 GB
Named bots only. Page types follow WooCommerce’s default URLs; comparison pages are a generated URL family on two stores.
Source: NdovuSEOLabs Crawl Analytics, 14–17 November 2026.

| Page type | Requests | Distinct paths | With parameters | Redirected | Errors |
|---|---|---|---|---|---|
| Product pages | 70,582 | 38,291 | 29% | 15% | 7% |
| Category and shop pages | 69,401 | 5,805 | 89% | 4% | 3% |
| Generated comparison pages | 66,714 | 46,938 | 6% | 25% | 4% |
| Images | 48,394 | 37,970 | 0% | 0% | 14% |
| API and AJAX | 21,149 | 1,016 | 6% | 0% | 4% |
| Scripts, styles and fonts | 18,251 | 5,116 | 94% | 0% | 11% |
| Homepage | 11,084 | 121 | 74% | 19% | 1% |
| Other pages | 9,099 | 3,077 | 5% | 66% | 16% |
| Sitemaps, feeds and robots.txt | 4,096 | 3,144 | 0% | 3% | 4% |
| Cart, checkout and account | 3,452 | 51 | 85% | 14% | 5% |
Table 3. Requests from named bots by page type (323,641 of the 332,783; spoofed, unknown and generic agents are not kept per page). Distinct paths ignore query values, which Ndovu never stores. Source: NdovuSEOLabs Crawl Analytics, 14–17 November 2026.
Bots split their effort very differently:
- Meta-ExternalAgent sent 48% of its requests to category pages and 17% to products.
- Googlebot sent 35% to products, 37% to comparison pages and 4% to categories.
- GPTBot sent 54% to comparison pages; OAI-SearchBot mostly fetched images (57%) and the homepage.
- Bingbot was the most even: 30% products, 26% images.
These are combined across the stores, so a bot’s split leans towards the stores where it was busiest.
Filtered category pages
88.7% of category requests carried a query string, against 29.3% for products. In 5 of 8 stores most category requests did. On the store where it was most extreme, category pages were 62% of all bot requests, 100% of them with parameters.
Filters multiply quickly: four filters with 10, 8, 6 and 5 options allow 2,400 combinations before sorting and paging. Google warns that this can cause overcrawling and slower discovery, and recommends a 404 for combinations with no results (Google). Decide which filtered pages deserve to be found, give those stable links, and keep the rest from producing new URLs. Our guide to investigating filtered URL crawling shows how to measure it.
Generated pages can outgrow the catalogue
Product-comparison pages, found on 2 stores, drew 66,714 requests across 46,938 different addresses in four days, more addresses than all product pages (38,291). They took 38.2% of recorded page data, and 25% were redirected.
A page made for every pair of products grows with the square of the catalogue. If those pages are useful in search, link the ones that matter; if not, stop linking every combination and check what the redirects point to. Either way, measure the same URL family again after the change.
Errors and the Bytespider pattern
Error responses were 6.9% of store requests and 5.0% of recorded data, higher than across the whole study. 14% of image requests and 11% of script and style requests failed, so look for removed product images and old theme files that are still linked.
Requests calling themselves Bytespider reached all 8 stores. 6,142 of 6,222 failed: 5,122 “not found” and 1,018 “forbidden”. 60% were for images. ByteDance publishes nothing to check them against, so this describes the name, not the company.
| If the errors are… | Check | Then |
|---|---|---|
| Current products or images | The exact response, and any security or cache layer in front | Restore access for the crawlers you want |
| Removed products | Internal links, sitemaps and feeds that still list them | Remove the old references; a 404 or 410 is correct |
| Invalid filter combinations | Which links generate them | Fix the links; keep the 404 |
| Redirects that never settle | The chain of redirect targets | Point each URL straight to its final address |
Where the data went
The stores’ access logs recorded 73.8 GB of responses to bots in four days. Product pages took 38% of recorded page data, generated comparison pages 38% and images only 6%. This is the response body the origin server logged; requests answered by a CDN never reach it, and it cannot be turned into a hosting cost without the bill.
Make sure bots can reach the catalogue
| Check | Why | Source |
|---|---|---|
| Menus link to categories, categories link to every product you want indexed | Googlebot generally does not use your search box to find products | |
| Later category pages have real links, not only a “Load more” button | Google’s crawlers do not click buttons; they follow <a href> links | |
| Each product has one main URL; variant, tracking and filter links do not create copies | Duplicate addresses split and waste crawling | Variants guide |
| New and changed products get requested soon after you publish them | Proves discovery, not just activity | Crawl Analytics |
Most stores do not have a crawl-budget problem: Google’s guide on it is for sites with over a million pages, or over 10,000 changing daily (Google). The problems visible in these stores were smaller and fixable: crawls spent on filters, generated pages and dead links instead of products. And a request is not a result: a GPTBot visit does not put a product in ChatGPT, and a Googlebot visit does not index it (OpenAI).
Method and limitations
| How it works | |
|---|---|
| Sample | 8 Kenyan online stores with server access logs, monitored by NdovuSEOLabs; not a random sample. 3 plugin-only stores excluded. |
| Period | 14–17 November 2026: four complete days in Kenyan time, 32 store-days. A pilot; later editions use 28 days. |
| Requests and shares | All automated requests except NdovuBot. Daily rates are each store’s total ÷ 4, then the mean or median. Average and median shares weight each store equally, with zero where a bot was absent. |
| Verification | Exact counts of requests matching the operator’s published IP ranges or reverse DNS. “No check” where none is published. |
| Page types | Each path classified by WooCommerce’s default URL patterns, inside the database. Named bots only. Query values are never stored, so distinct paths undercount filter combinations. |
| Data | Response body size from the access log, headers excluded. GB = 10⁹ bytes. |
| Not measured | Checkout steps completed, indexing, rankings, sales, hosting cost, and long-term trends. |
Original research by NdovuSEOLabs, from Crawl Analytics data. You may cite these figures with a link to this page.