

Ndovu research on 20 Kenyan websites: which search and AI crawlers reached them, how much they requested, and why the busiest bot is not the most common.
Three answers to one question. Googlebot and Bingbot reached every website in our main sample with verified requests. Applebot made the most requests overall. GPTBot took the largest share on the average website.
We looked at 20 Kenyan websites monitored by NdovuSEOLabs over 14–17 November 2026. The 14 with server access logs recorded 1,669,357 requests from crawlers and other automated agents, not counting our own NdovuBot. Every figure is an aggregate; no website is named.
Key findings
- 78.4%of all bot requests came from three websites, so the busiest bot overall is not the most common one.
- 84.6%of requests came from crawlers verified against their operator’s published addresses.
- 42% vs 3%GPTBot’s average share on content sites against stores: very different bot mixes.
- 1.8%of recorded data went on error responses, though they were 3.5% of requests.
What we studied
Websites in the study, by sector and data source


- Server access log n=14
- WordPress plugin only n=6
Websites with data for the whole period. Server-log websites are the main sample; plugin-only websites see fewer requests and are reported apart.
Source: NdovuSEOLabs Crawl Analytics, 14–17 November 2026.
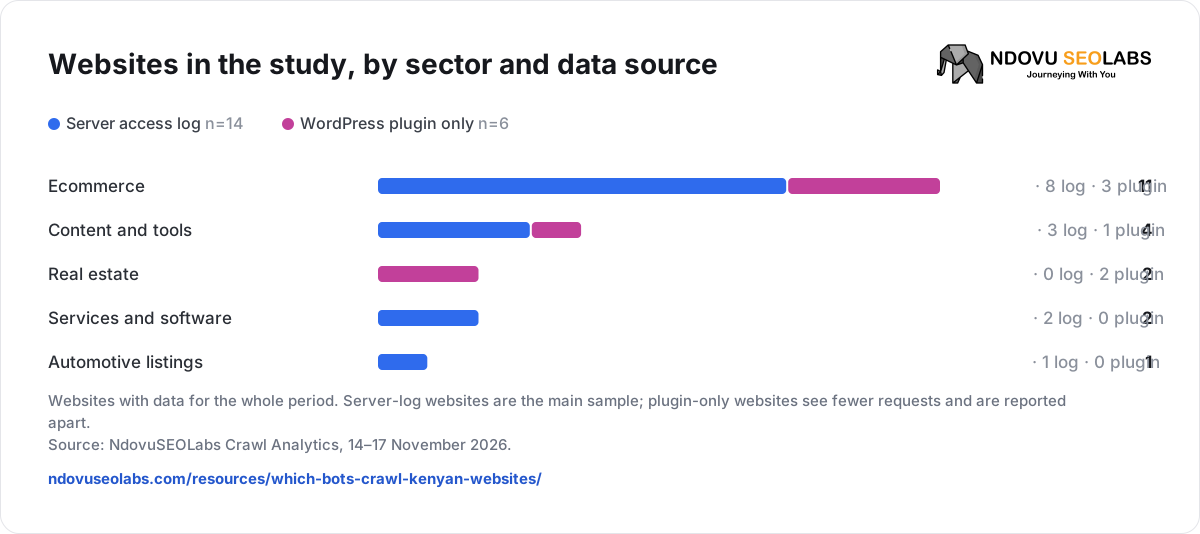
We keep the two collection methods apart, because they see different requests:
- Server access logs (14 websites). Every request the web server logged, including images, files and errors that never reach WordPress. This is the main sample for every ranking below.
- WordPress plugin only (6 websites). Only requests that reach WordPress; pages served from a cache or blocked earlier are missed. Reported separately. Why the sources differ.
All comparisons use the same four complete days, 14–17 November 2026: 56 website-days in the main sample. Real estate and services are too small for sector figures in this edition.
Which bots made the most requests
| Bot | Requests | Share of all requests | Verified |
|---|---|---|---|
| Applebot | 388,366 | 23.26% | >99.9% |
| GPTBot | 348,574 | 20.88% | >99.9% |
| Meta-ExternalAgent | 184,444 | 11.05% | >99.9% |
| Amazonbot | 125,206 | 7.50% | 99.9% |
| Meta-ExternalAds | 90,975 | 5.45% | 100.0% |
| ClaudeBot | 55,907 | 3.35% | 99.8% |
| ShapBot | 43,533 | 2.61% | No check |
| Googlebot | 40,172 | 2.41% | 99.4% |
| SemrushBot | 30,283 | 1.81% | No check |
| Bingbot | 28,678 | 1.72% | 99.9% |
Table 1. The ten named crawlers with the most requests across 14 websites. Shares use all 1,669,357 external requests, including unnamed agents. “Verified” is the part that matched the operator’s published IP ranges or DNS; a claim alone does not count. “No check” means the operator publishes no IP ranges or DNS names to check a server log against. Source: NdovuSEOLabs Crawl Analytics, 14–17 November 2026.
Applebot’s total is real traffic: >99.9% of it verified. Crawlers from one company stay separate here (Googlebot and Googlebot-Image; Meta’s agents), because they do different jobs.
Why the leader changes when every site counts equally
The busiest bot overall vs the biggest on the average website
- Share of all requests n=1,669,357 requests
- Average share per website n=14 websites
Pooled share lets the busiest websites dominate; the average per website gives each website one vote, with zero where a bot was absent. NdovuBot excluded.
Source: NdovuSEOLabs Crawl Analytics, 14–17 November 2026.
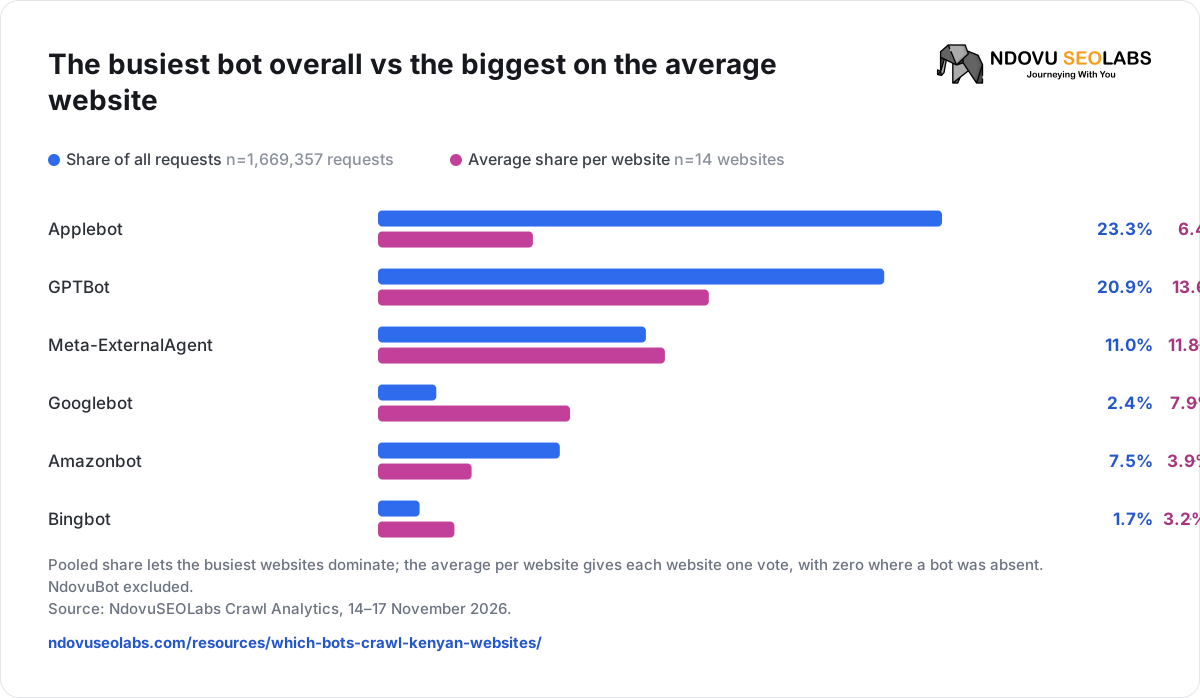
Most of Applebot’s volume came from a single website (84.4%). Its median share per website was 0.59%, against 6.05% for Googlebot. Give every website equal weight and GPTBot leads with 13.64%.
| Measure | Answers |
|---|---|
| Share of all requests | Which bots create the most work across all the websites together. |
| Average share per website | What a typical website’s bot mix looks like, with each site weighted equally. |
| Median share per website | The middle website, unaffected by a few very busy ones. |
Googlebot and Bingbot reached every website
| Bot | Websites with the name | Websites with verified requests |
|---|---|---|
| Googlebot | 14 of 14 | 14 of 14 |
| Bingbot | 14 of 14 | 14 of 14 |
| Googlebot-Image | 14 of 14 | 14 of 14 |
| OAI-SearchBot | 14 of 14 | 13 of 14 |
| GPTBot | 13 of 14 | 12 of 14 |
| Applebot | 12 of 14 | 12 of 14 |
| ClaudeBot | 12 of 14 | 10 of 14 |
| PerplexityBot | 10 of 14 | 6 of 14 |
Table 2. How many websites each bot reached. A name in the user-agent is only a claim; verification checks the request came from the operator. Source: NdovuSEOLabs Crawl Analytics, 14–17 November 2026.
Where the two columns differ, some requests used the name without coming from the operator’s addresses. That is not proof of bad intent, but those requests should not be counted as the real crawler. Google explains how to check its crawlers (Google).
What ecommerce websites saw
The 8 online stores with server logs recorded 332,783 requests. The average store received 10,399 requests a day; the median store, 3,365. A few busy stores pull the average up, so the median is the better guide for a typical shop.
| Bot | Average share per store | Median share per store | Average on content and tools sites |
|---|---|---|---|
| Meta-ExternalAgent | 17.14% | 12.35% | 5.67% |
| Googlebot | 11.21% | 9.45% | 2.24% |
| GPTBot | 3.28% | 0.74% | 41.65% |
Table 3. Selected bots on 8 stores and 3 content and tools websites, each website weighted equally. Source: NdovuSEOLabs Crawl Analytics, 14–17 November 2026.
Meta’s crawler and Googlebot dominated the stores; GPTBot dominated the content sites. Site size, the number of crawlable URLs and robots.txt rules could all explain the gap; this study does not isolate them. The 3 stores measured only through the plugin averaged 450 requests a day, a different set of websites seen through a narrower source, so the two figures should not be compared.
Which bots used the most data
Share of requests vs share of data, by bot
- Share of requests n=1,669,357
- Share of recorded data n=250 GB
Data is the response size each server logged (body only, headers excluded). Bots ranked by data received.
Source: NdovuSEOLabs Crawl Analytics, 14–17 November 2026.
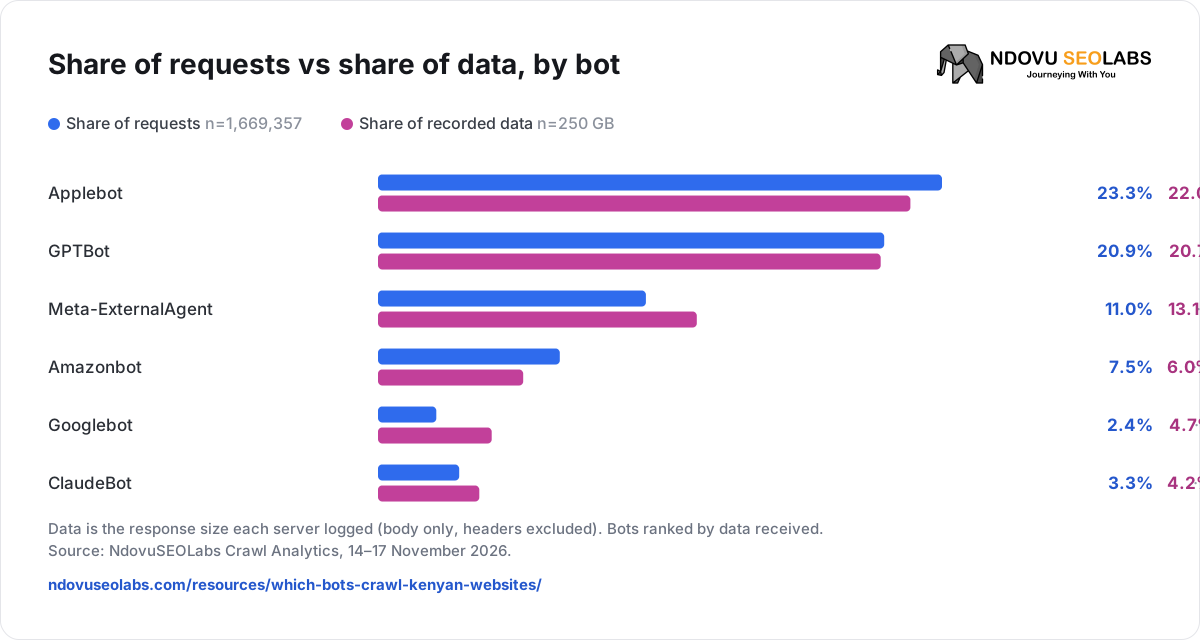
The server logs recorded 250 GB of responses to these bots over four days. Googlebot made 2.4% of requests but received 4.7% of the data: its average response was 292 KB, against 150 KB for all bots. This is bot data only, so it cannot tell you what share of a website’s total bandwidth bots use, or what they cost; that needs the human traffic and the hosting bill too.
Errors: a small share of the data, one pattern to investigate
Error responses (403, 404, 429 and 5xx) were 3.5% of requests and 1.8% of recorded data. Most of that data (87%) was 404 responses, which on most WordPress sites are full themed pages.
One name stood out. Requests calling themselves Bytespider reached 12 websites; 9,130 of 9,210 (99.1%) got an error: 6,365 “not found” and 2,763 “forbidden”. None could be verified as ByteDance, so this describes the name, not the company.
An error is not automatically a fault: a removed page should return 404, and Google recommends 404 for empty filter combinations (Google). Repeated errors, redirect loops and expanding filter URLs are separate problems, each needing URL-level evidence; they are the subject of later editions. For Google, 429 and 5xx responses slow crawling down; other 4xx responses do not change the crawl rate, but Google crawls those URLs less often over time (Google).
A crawler request is not AI visibility
OpenAI runs separate agents: GPTBot gathers content for its foundation models, OAI-SearchBot is for search, and ChatGPT-User fetches a page when a person asks rather than crawling on its own (OpenAI). A GPTBot request does not mean a page appeared in an answer, and a Googlebot request does not mean it was indexed. This study measures requests only. For the later steps, see AI mentions, citations and referral traffic.
Check your own website
| Question | What to look at |
|---|---|
| Do the right crawlers reach my important pages? | Verified requests and response codes for your key products, categories or listings. |
| Is my bot traffic normal? | Compare with similar websites, the same period and the same source. Use the median, not just the average. |
| Am I wasting crawls? | Group requests by section and parameter, then check errors, repeats and response sizes before changing robots.txt. |
| Did my fix work? | The same URL groups and source over a comparable period after the change. |
Ndovu’s Crawl Analytics shows these by bot, verification, response and page. For filtered URLs, see how to investigate faceted URL crawling.
Method and limitations
| How it works | |
|---|---|
| Sample | 20 Kenyan websites monitored by NdovuSEOLabs with data for the period; not a random sample of the Kenyan web. Sector labels describe each business. Some sites serve visitors outside Kenya. |
| Period | 14–17 November 2026, four complete days in Kenyan time. Server logs for these websites start in mid-November 2026, so this is a pilot; later editions use 28 days. |
| Requests | Every request from a crawler, named or generic automation, and unknown agents. Our own NdovuBot (23,537 requests) is excluded. Requests, not unique pages or visitors. |
| Shares | Pooled: a bot’s requests ÷ all requests. Average and median: the bot’s share on each website, then the mean or median across websites; a website with none counts as zero. |
| Verification | A request is verified when its IP matches the operator’s published ranges or passes reverse-then-forward DNS. Exact counts, not rounded. |
| Data | The response size in the server log: body size without headers as the server logs it, not bytes on the wire. Redirects and 304s record 0. GB = 10⁹ bytes. |
| Privacy | Websites are anonymous. Groups of fewer than three get coverage counts only. |
| Not measured | Long-term trends, rankings, indexing, AI citations, human visits, hosting costs, redirect loops and crawl traps. |
Original research by NdovuSEOLabs, from Crawl Analytics data. You may cite these figures with a link to this page.
Coming next in this series
- How bots crawl ecommerce websites in Kenya: products, categories, filters and generated pages.
- Which bots use the most bandwidth: data by bot, sector, page type and response.
- Crawler bandwidth on error responses: 404, 403, 429 and 5xx by bot, sector and status.
- How generated URLs create crawl traps: large URL families, tool settings and filters.
- Redirect chains, loops and repeated requests: traced redirects and rate limiting.
- Why bot traffic can spike after moving to a CDN: caching, bot protection and what logs can see.
- Crawl waste after a fix: before-and-after measurements.
- Property websites: once enough real estate websites contribute server logs.