

Report guide
Read Site Monitoring
Uptime, incidents, renewals, checks and status pages, view by view.
The question it answers
Is my site up, and is anything about to lapse?
Where it is
Sidebar → Site health → Site Monitoring. Views: Overview & uptime, Incidents, Domain SSL & DNS, Hosting & renewals, Errors & response times, Checks, Site events, Alerts and Settings.
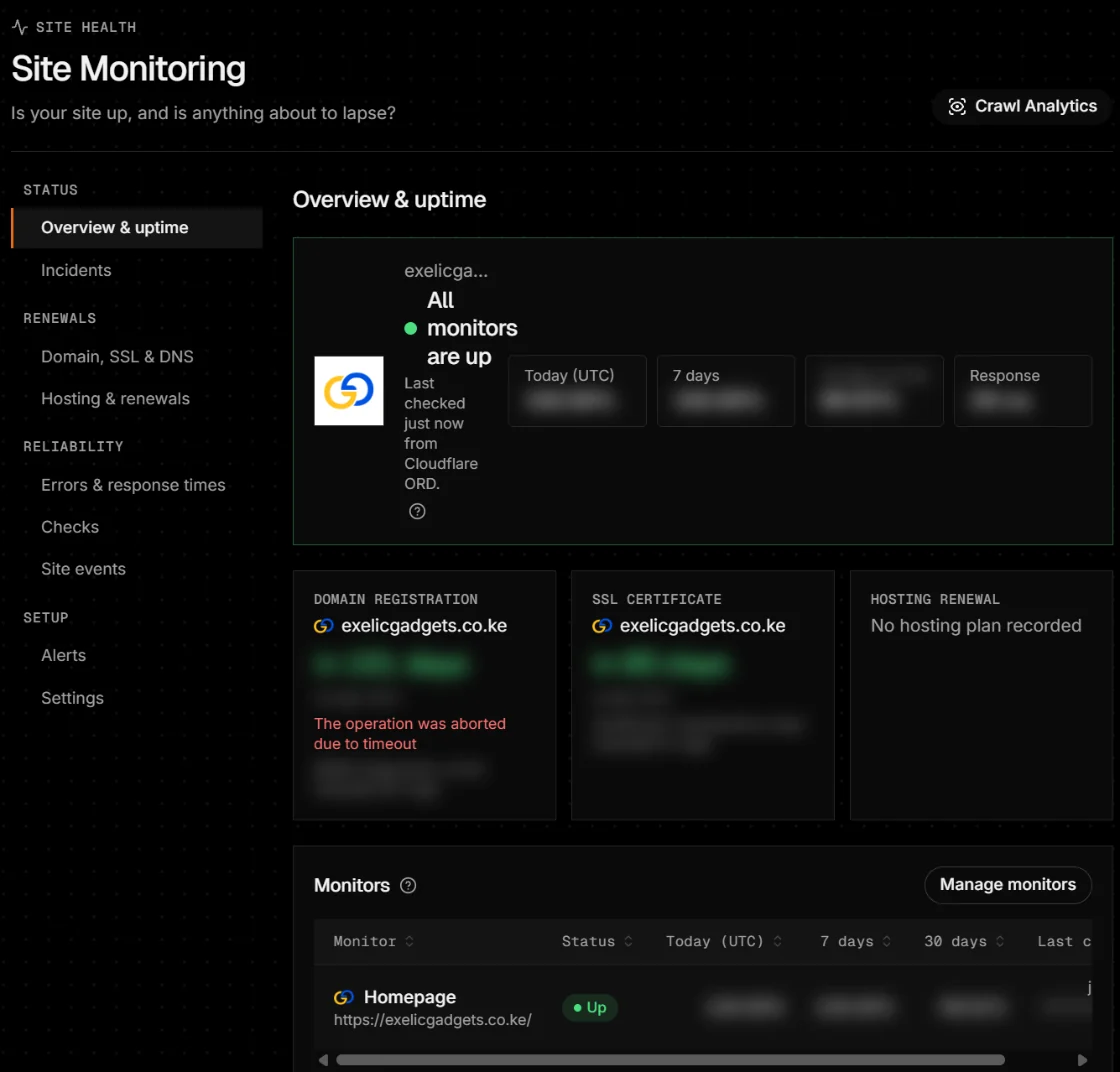
Uptime and incidents
The homepage is checked every five minutes from Cloudflare’s network (every minute on paid plans if you choose). An outage is confirmed only when a second check fails too.
- Up / Degraded
- Answering normally, or slowly.
- Checking a failure
- One check failed; a second is running.
- Down
- Confirmed; an alert is raised.
- Recovering
- One good check; a second resolves the incident.
- Maintenance / Paused
- Inside a maintenance window, or switched off.
Day strips are green at 99.9% or more, amber from 99%, red below, grey without checks.
Add monitors
Open Settings and click Add page, Add API check or Add heartbeat.
Give a Name and URL. Optional: Accepted status (e.g. 200-399), Text the page must contain, a JSON field for APIs, Check every (minutes), Critical.
For a heartbeat, copy the Heartbeat URL (shown once) and call it at the end of your scheduled job.
Requests identify themselves as NdovuSEOLabs-Monitor. API checks use GET or HEAD only.
Renewals
- Domain registration from the registry (RDAP), refreshed daily.
- SSL certificates checked twice a day: expiry and trust.
- DNS records every six hours; nameserver, mail and CAA changes alert.
- Hosting & renewals: add your hosting plans and payment dates to get reminders.
Reliability views
- Errors & response times: requests, blocks and response times from your server logs.
- Checks: daily pass/fail checks such as “Verified Googlebot isn’t blocked” and “robots.txt answers”; Run checks now.
- Site events: deployments, plugin updates, redirect changes and more, to line up with traffic changes.
Status page and maintenance
- Public status page (Max and Ultra): choose which monitors show, under public names. It never shows URLs or error messages.
- Maintenance windows: checks inside a window open no incidents and don’t count against uptime.
When data is empty, late or unavailable
- Not monitored
- Click Start monitoring.
- No incidents recorded
- Single failed checks that weren’t confirmed aren’t kept.
- No alert channel yet
- Alerts are recorded but not sent. Add a channel.